Inspired by @dnutan and @oneitonitram in Howto install MeshCentral on NethServer, here’s a howto about installing TacticalRMM, a remote monitoring & management tool for Windows computers, built with Django, Vue and Golang. It uses an [agent]( amidaware/rmmagent: Tactical RMM Agent (github.com)) written in Golang and integrates with MeshCentral. I decided to use the [docker version]( Docker Install - Tactical RMM Documentation) to ease configuration between the components, avoid installation issues and port conflicts. I tried native install without success here.
Installation
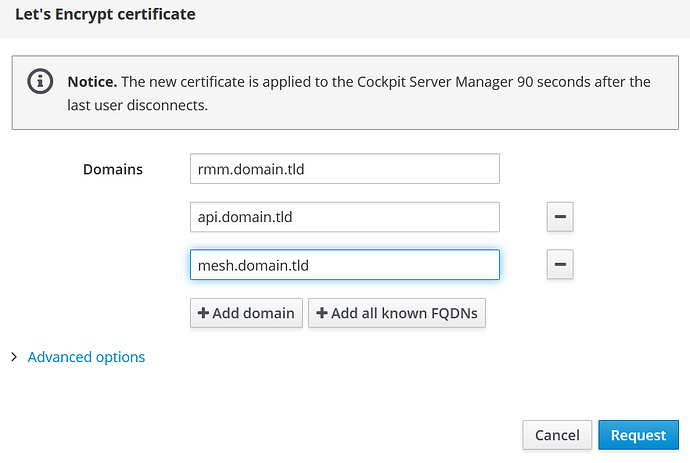
Setup 3 domains
You need to setup 3 domains like in the following example:
- api.domain.tld
- mesh.domain.tld
- rmm.domain.tld
Request a Letsencrypt cert
Ensure that the domains are resolvable via DNS to get a certificate for them.
For a local network test (no public agents) I port forwarded 80 and 443 to my VM just for getting the certs and removed the port forwarding again.
The better way is to use real public domains on a NethServer in Gateway mode (red and green) or port forward 80,443 and 4222 (agent connect port) to a Nethserver in Server mode (green only). It should work on a VPS too (without port forwarding).
Install docker, enable portainer and update the system:
yum -y install nethserver-docker
config setprop docker enableRepository enabled
config setprop portainer status enabled
signal-event nethserver-docker-update
yum -y update
Install docker-compose
curl -L "https://github.com/docker/compose/releases/download/1.29.2/docker-compose-$(uname -s)-$(uname -m)" -o /usr/local/bin/docker-compose
chmod +x /usr/local/bin/docker-compose
Get rmm docker files
mkdir ~/tactical
cd ~/tactical
wget https://raw.githubusercontent.com/amidaware/tacticalrmm/master/docker/docker-compose.yml
wget https://raw.githubusercontent.com/amidaware/tacticalrmm/master/docker/.env.example
mv .env.example .env
Prepare .env file
Edit .env and edit the 3 domains and maybe edit usernames and passwords for security for production use:
APP_HOST=rmm.domain.tld
API_HOST=api.domain.tld
MESH_HOST=mesh.domain.tld
Add Letsencrypt certs to the .env file (if you do this step more often you need to manually remove duplicated lines):
echo -e "\n# certs" >> .env
echo "CERT_PUB_KEY=$(sudo base64 -w 0 /etc/pki/tls/certs/localhost.crt)" >> .env
echo "CERT_PRIV_KEY=$(sudo base64 -w 0 /etc/pki/tls/private/localhost.key)" >> .env
Prepare docker-compose.yml
Edit docker-compose.yml and add default external network named aqua to networks (last 3 lines here):
networks:
  proxy:
    driver: bridge
    ipam:
      driver: default
      config:
        - subnet: 172.20.0.0/24
  api-db:
  redis:
  mesh-db:
  default:
    external: true
    name: aqua
Change the local ports for 80 to 8010 and 443 to 8011 and add default network for container tactical-nginx (before ports:):
  tactical-nginx:
    container_name: trmm-nginx
    image: ${IMAGE_REPO}tactical-nginx:${VERSION}
    restart: always
    environment:
      APP_HOST: ${APP_HOST}
      API_HOST: ${API_HOST}
      MESH_HOST: ${MESH_HOST}
      CERT_PUB_KEY: ${CERT_PUB_KEY}
      CERT_PRIV_KEY: ${CERT_PRIV_KEY}
    networks:
      proxy:
        ipv4_address: 172.20.0.20
      default:
    ports:
      - "8010:8080"
      - "8011:4443"
    volumes:
      - tactical_data:/opt/tactical
Add default network for container trmm-nats (last line):
  # nats
  tactical-nats:
    container_name: trmm-nats
    image: ${IMAGE_REPO}tactical-nats:${VERSION}
    restart: always
    environment:
      API_HOST: ${API_HOST}
    ports:
      - "4222:4222"
    volumes:
      - tactical_data:/opt/tactical
    networks:
      proxy:
        aliases:
          - ${API_HOST}
      default:
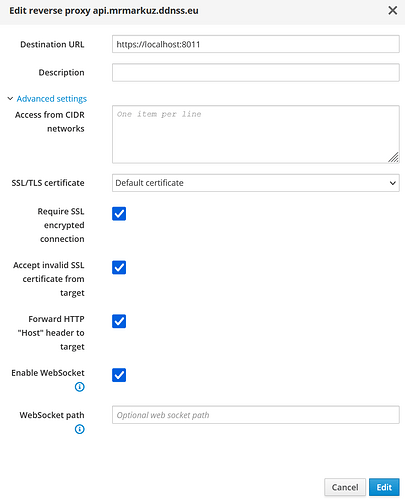
Add 3 reverse proxies from
- api.domain.tld
- rmm.domain.tld
- mesh.domain.tld
to https://localhost:8011 and enable all advanced options:
Add tactical service to open port 4222 for agents, for LAN only “green” instead of “red,green” is needed:
config set tactical service TCPPort 4222 access red,green status enabled
signal-event firewall-adjust
Fire up Tacticalrmm containers
To be sure Docker firewall is working:
signal-event nethserver-docker-update
Start containers:
docker-compose up -d
First login
Wait a few minutes and browse to https://rmm.domain.tld and login with username tactical and password tactical if you didn’t change it in the .env file.
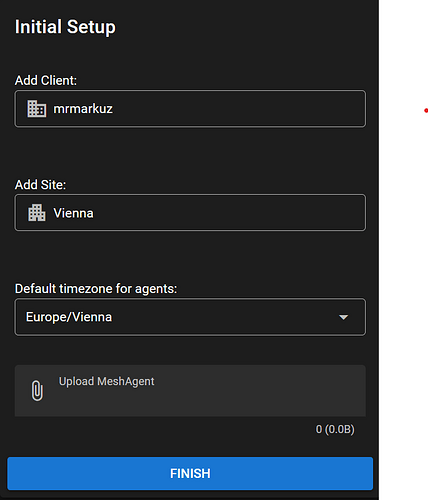
On first login you need to setup 2FA (I used FreeOTP on Android) and do some basic config like create a client and a site and region settings.
Get meshagents
Next step is to get the Meshagents from Meshcentral, so browse to https://mesh.domain.tld and login with username tactical and password tactical if you didn’t change it in the .env file.
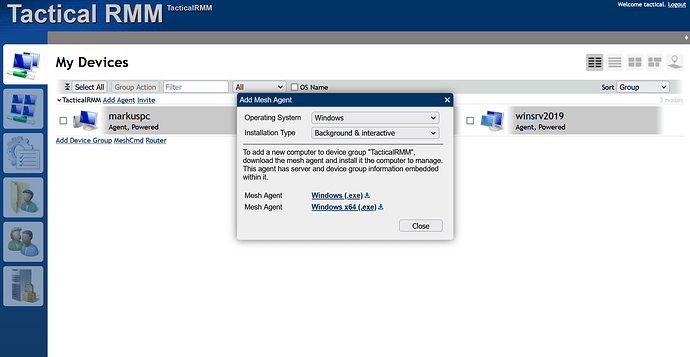
Click on “Add Agent” to open the window with the agent downloads, download both the x86 and x64 version.
Upload agents
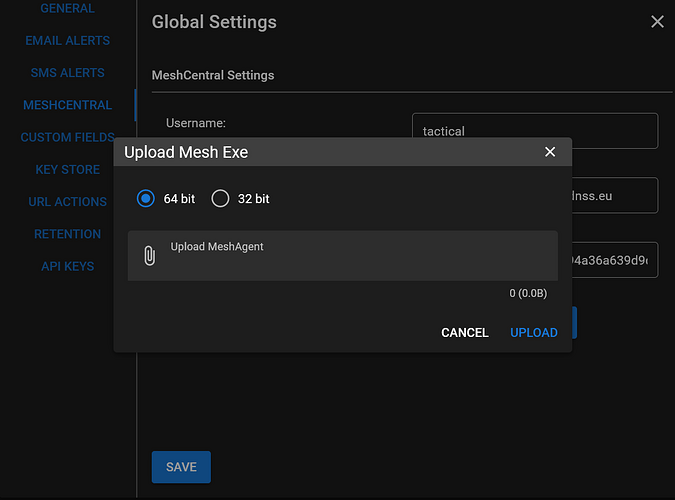
Back in Tactical RMM in “Settings/Global Settings/Meshcentral” you need to upload the meshagents downloaded in the previous step:
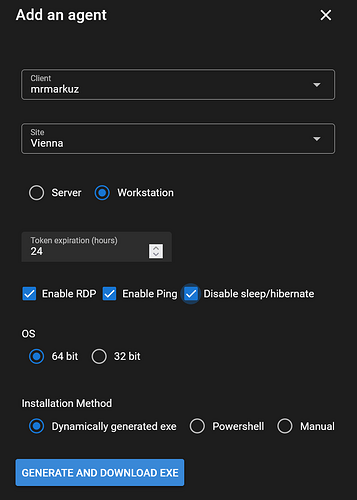
Now it’s time to install an agent, in TacticalRMM go to “Agents/Install Agent” and “generate and download the exe” and run the agent installation on a client. You may need to fix Antivirus issues.
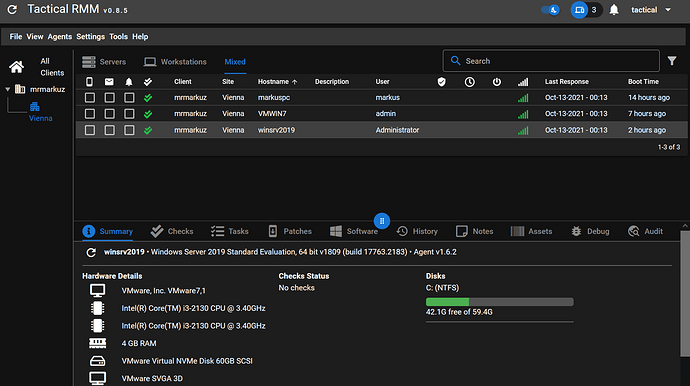
After agent installation you should see the client in Tactical RMM (maybe you need to refresh):
Reset 2FA
In this example 2FA is resetted for user tactical:
docker exec -it trmm-backend python manage.py reset_2fa tactical
Reset tacticalrmm
Remove containers and volumes:
cd ~/tactical
docker-compose down -v
Start up again:
docker-compose up -d
Grafana integration
Create volume for persistence:
docker volume create grafana-storage
Run Grafana docker with needed plugin, persistence and in same network as tactical postgresql:
docker run -d -p 3010:3000 --name=grafana --network=tactical_api-db --restart always -e "GF_INSTALL_PLUGINS=grafana-worldmap-panel" -v grafana-storage:/var/lib/grafana grafana/grafana
Add aqua network to grafana container:
docker network connect aqua grafana
Setup a domain grafana.domain.tld and use another reverse proxy to http://localhost:3010
Login to https://grafana.domain.tld with user admin and password admin and change the password.
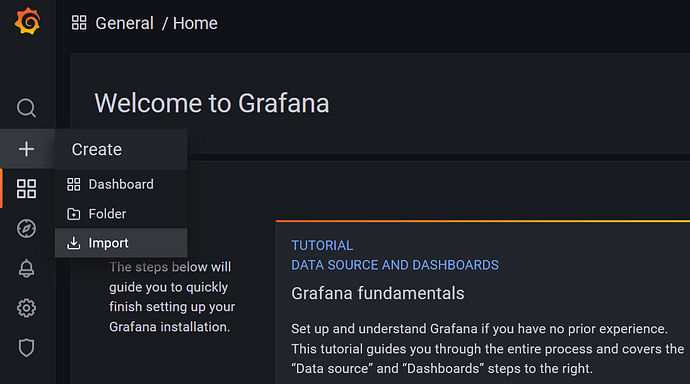
Import TacticalRMM Dashboards
Download the dashboard json files and import them to Grafana dashboards.
Create URL action (did not work in my test)
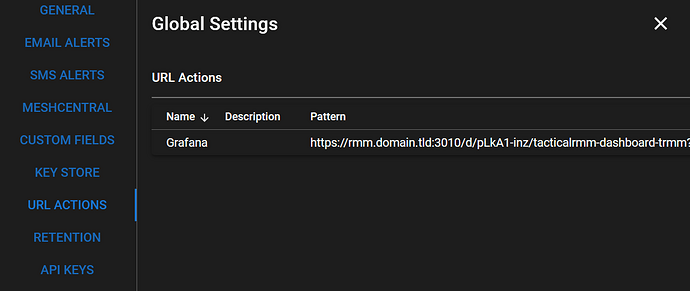
Create an URL action in TacticalRMM Global Settings, only edit the domain to your grafana domain:
URL Pattern: https://grafana.domain.tld/d/pLkA1-inz/tacticalrmm-dashboard-trmm?orgId=1&var-Client={{client.name}}&var-Sites={{site.name}}&var-Agents_HostName={{agent.hostname}}
Enable cpu,disk,ram checks for a client and run the URL action on this client in tacticalrmm.
It should open a browser showing the grafana dashboard for the client, in my test it didn’t work.
Add tacticalrmm data source
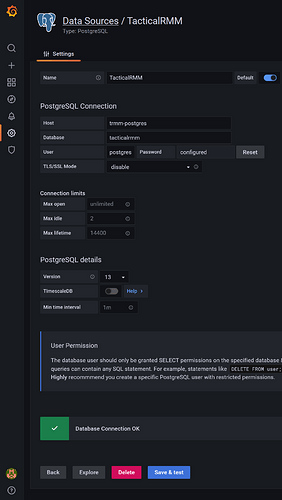
Add postgresql data source to Grafana(here with the default passwords):
Set to default to be used by the new dashboards
Host: trmm-postgres
Database: tacticalrmm
User: postgres
Password: postgrespass
Disable TLS/SSL and “Save & test”
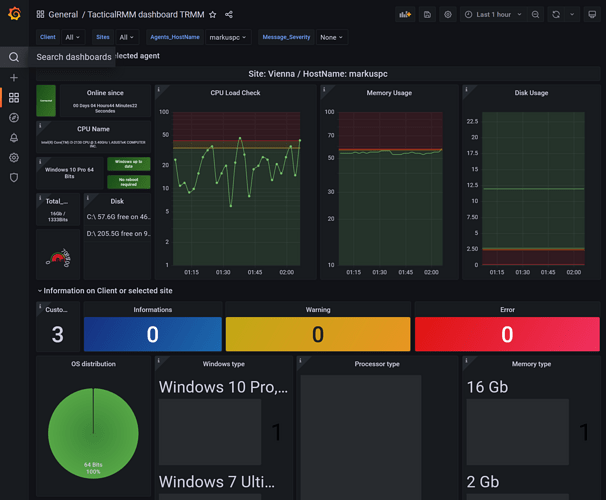
Now it should be possible to view TacticalRMM stats in Grafana.
