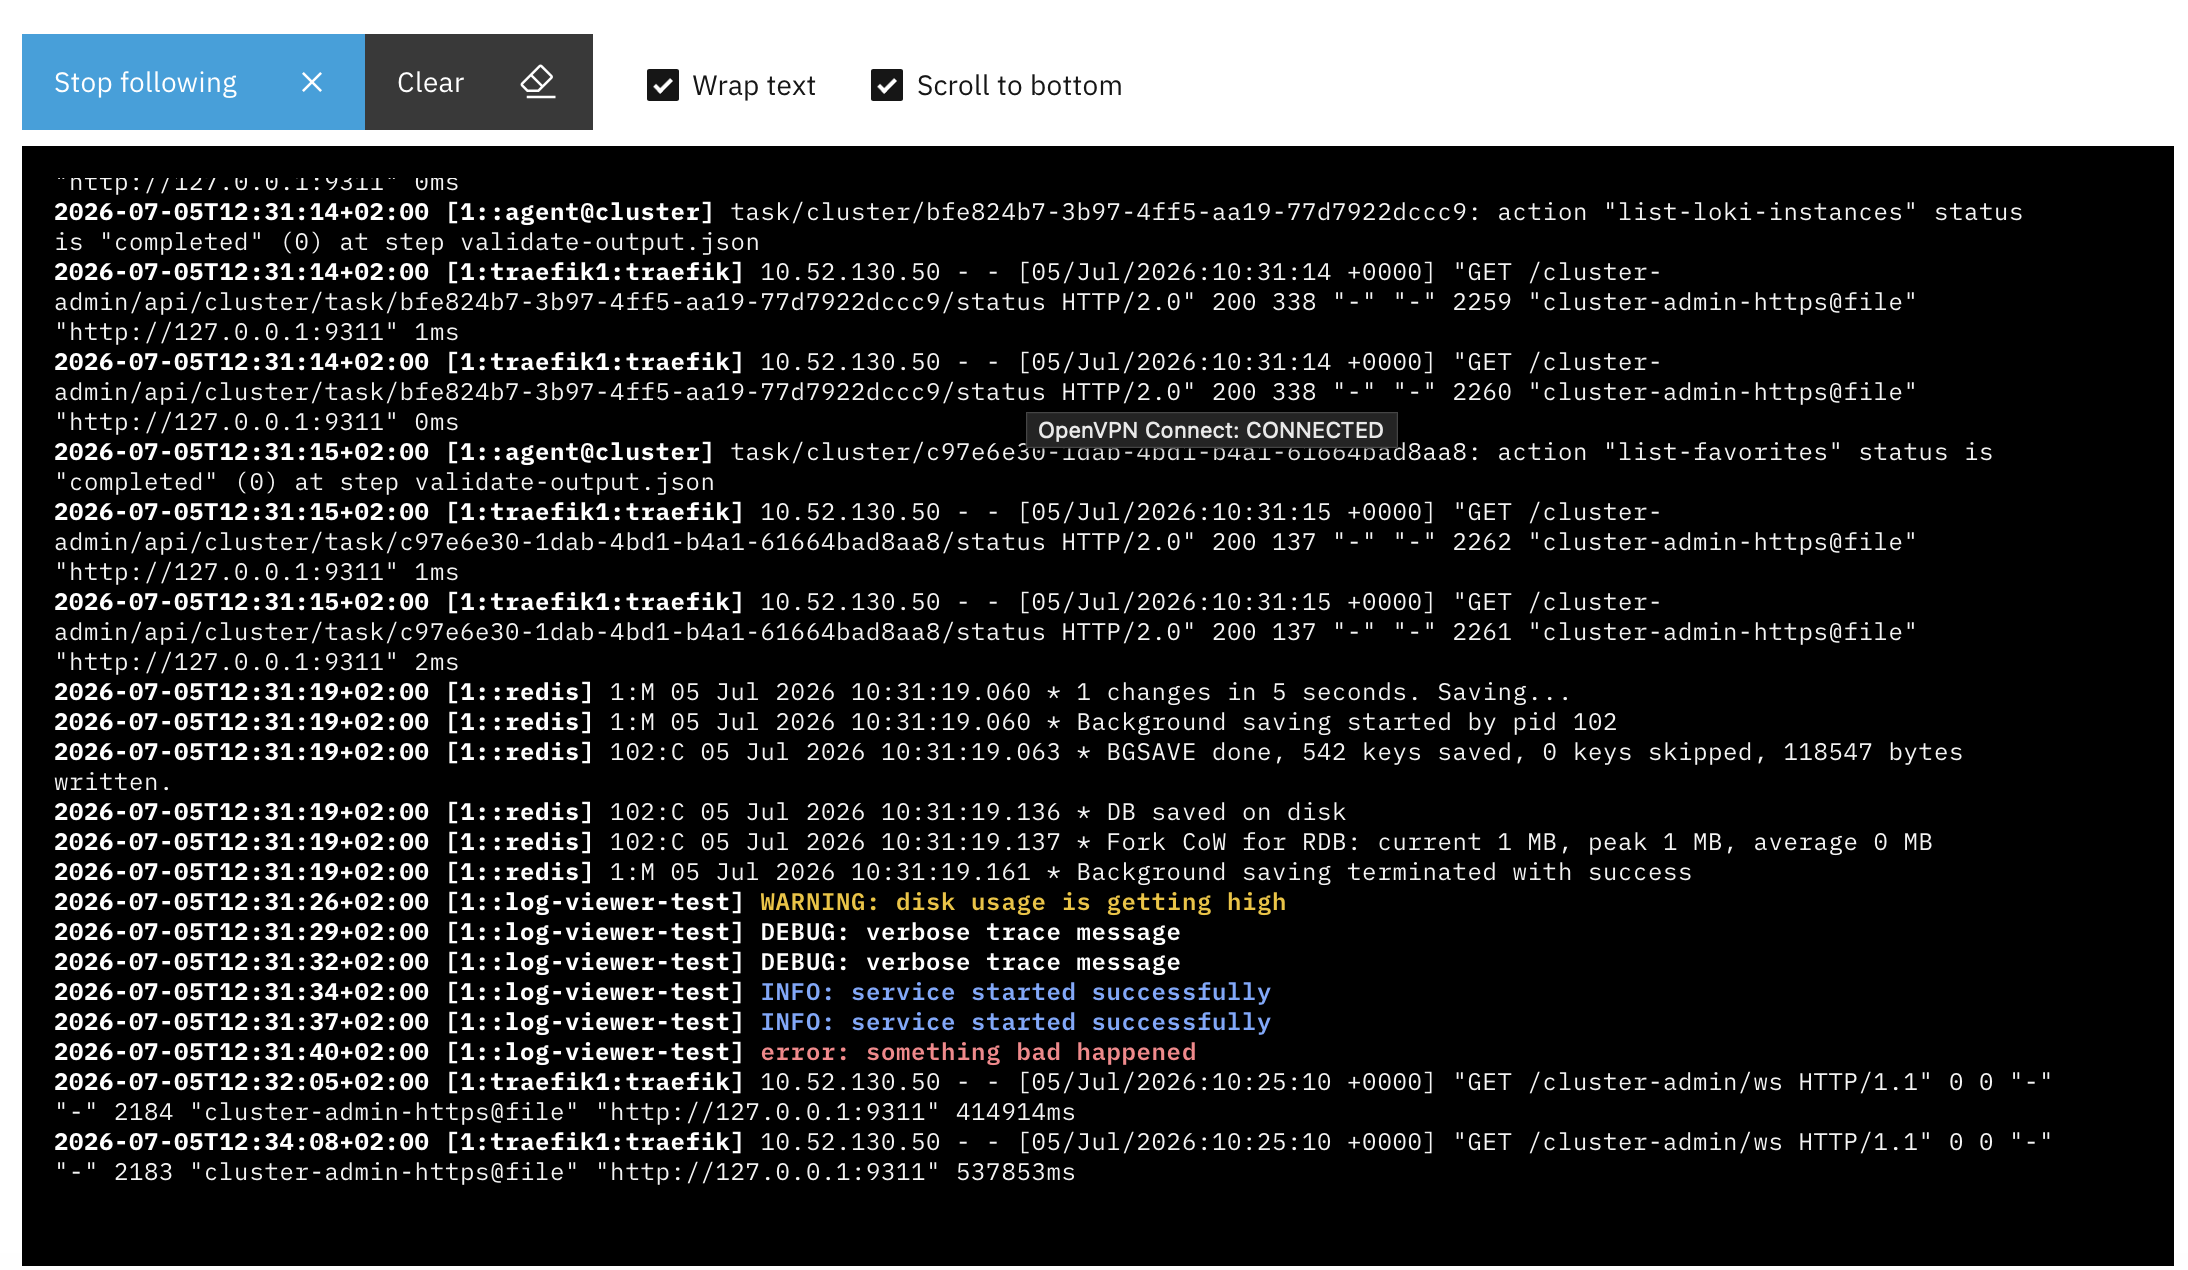
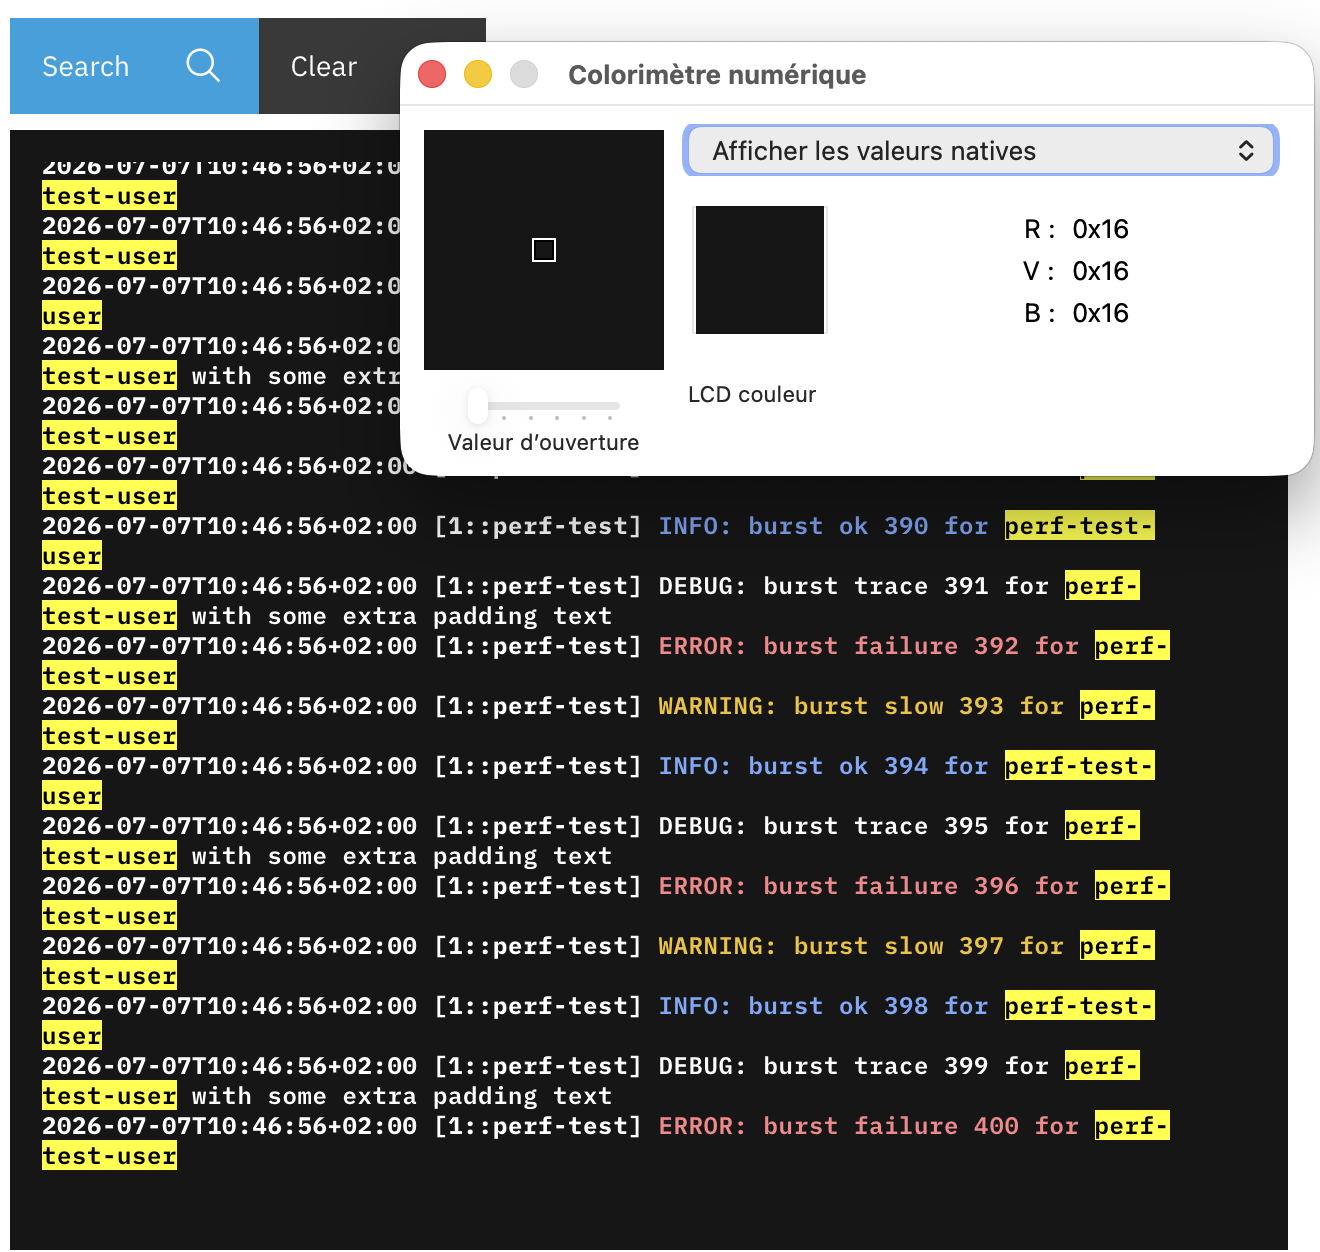
The code should be safe from a security perspective (e.g., XSS injection). The only consideration I have is regarding performance, since the highlighting library now has to manage 6 queries instead of 1. I think thorough tests with large output dumps are needed to make sure the client-side work does not overload the browser page.
Another (very, very minor) consideration is to use dark gray instead of full black as the background color, as a general design rule. Maybe we can use the #161616 or the #393939 from the IBM Carbon palette. But let’s hear our designer @Lucia_A about this.
Nice work Matthieu, this is a very useful improvement!
From a UX point of view, syntax coloring makes the log viewer much easier to scan, especially with long outputs.
I agree with Andrea about the background: I would avoid pure black and use a dark gray instead, in line with the Carbon palette, gray100 #161616 could be a good option for the darkest variant.
My only design notes are to keep the color palette limited, make sure all colors have enough contrast on the dark background, and avoid relying only on color to communicate severity. The textual labels like WARNING, INFO, DEBUG and error should remain clearly visible.
Overall, I think this is a good direction and would improve readability a lot
Also based On Logging is it possible to log for certain services by selecting the service you want to view the logs. eg We have 3 services in documenso
I think app component filtering is something to do on the server side.
Back to the color highlighting topic, the PR is surely a good starting point. However I feel we should return a severity code to simplify its LOG_LEVEL_QUERIES array. Indeed it is based on log string conventions rather than the real log information.
I did an empirical test : on a MacBook Air M2, dumping 2000 lines with syntax colouring takes 5 seconds using Safari (including network time). The browser looks totally happy with it.
Your MacBook is probably too powerful to be considered a meaningful test, but it’s a good starting point. We can perform more tests while reviewing your PR
I tasked Claude to assess the current implementation regarding PRIORITY fields vs Log level strings. Here is His conclusions
Re: severity code vs. LOG_LEVEL_QUERIES
Good point in principle — using a structured severity would be more robust than pattern-matching log text. Before making that change though, I checked what’s actually in the PRIORITY field (systemd journal syslog priority) across a real production instance, since that’s the only structured severity signal currently flowing through the pipeline (journald → Alloy → Loki).
Sampled ~50k recent entries, grouped by SYSLOG_IDENTIFIER:
High-volume services are flat at info regardless of content: grafana (16990 lines), redis (239), backup3 (806), podman(136) — 100% PRIORITY=6, even for lines that clearly describe errors in their text.
Other services are flat at error, also regardless of content: prometheus (82), crowdsec3 (64), node_exporter (56), ldapproxy (23) — 100% PRIORITY=3. This looks like the classic stderr-capture default (systemd/podman tags anything written to stderr as priority 3), not the app actually signaling severity.
Only a handful of sources (systemd itself, the NS8 agent@* processes, promtail, sshd) show real variation across priority levels.
So switching to PRIORITY wouldn’t just be “no signal” for most logs — for several services it would actively mislead, painting every single line from prometheus/crowdsec3/node_exporter/ldapproxy red regardless of actual severity, which is worse than today’s text-based heuristic (which only flags lines that literally contain ERROR/WARN/etc.).
The underlying idea (structured > string-sniffing) is right, but it’d require every module to properly tag its log severity at the source — a much bigger change than this PR, and one that depends on modules we don’t control. Given the current data, I’d suggest keeping the text-based LOG_LEVEL_QUERIES approach for now, and revisiting a structured-severity model separately if/when journal PRIORITY becomes a reliable signal across modules.