Jim
September 7, 2015, 7:02pm
1
Hello,
I already said, I come from ClearOS, I’ve try this distro because it`s was my first distro of choice when I was managing to upgrade my router.
Before, installing my Microserver, I had a Ubiquity Edgerouter POE 5 ports… This router is an wonderfull routeur with linux based system named EdgeOS, a derivative a Vyatta, itself a derivative of Debian.
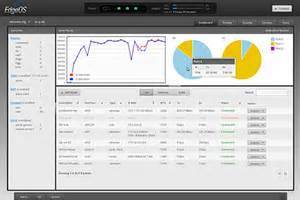
EdgeOS is not only powerful, it has a beautiful and intuitive interface, but further this has good graphics monitoring tools, like this:
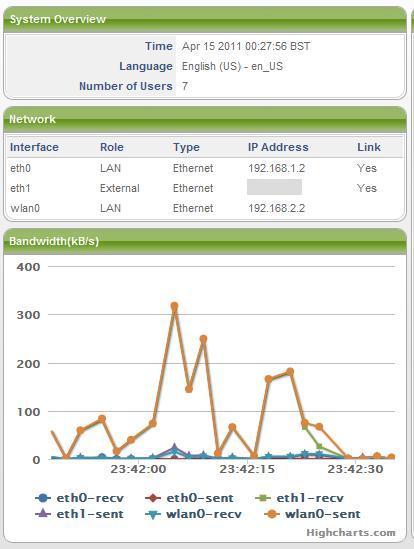
ClearOs has a same king of tools:
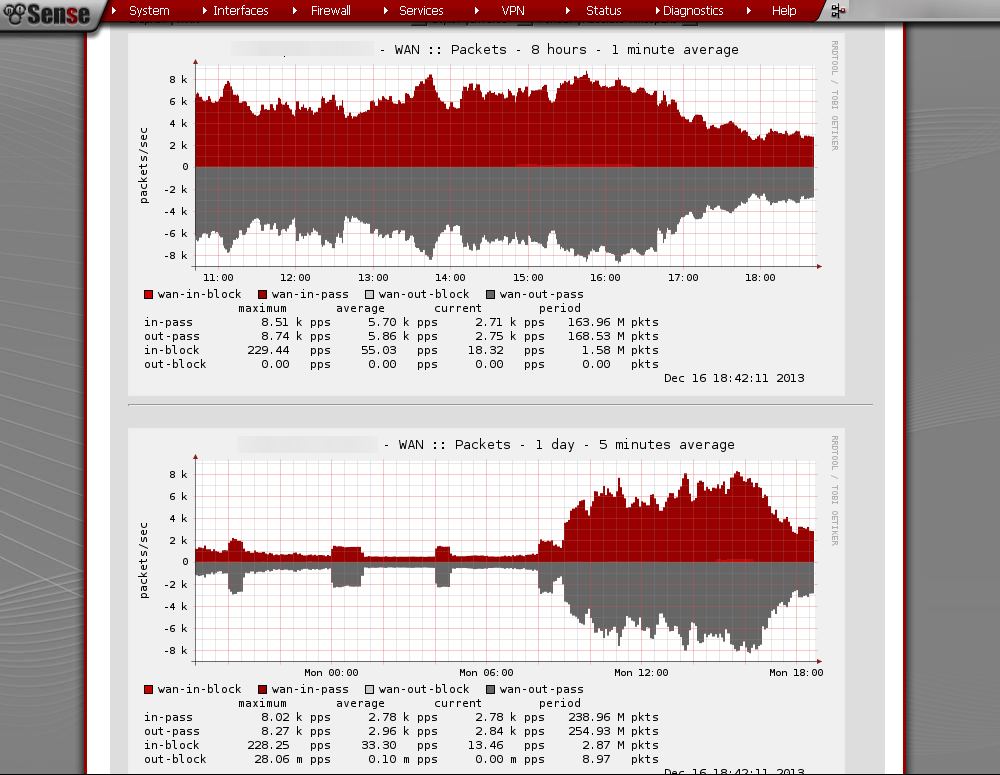
Pfsense have such tool too:
Because one graph could be a good monitoring tool, I would love to have such graphs in Nethserver…
What do you think of such tools?
giacomo
September 8, 2015, 6:54am
2
You already have them.http://docs.nethserver.org/en/stable/statistics.html
TL;DR
yum install nethserver-cgp
Lewis
October 21, 2015, 10:18am
3
@giacomo I have just installed collectd, will it start collecting data for automatically or do I have to configure something?
Lewis
October 21, 2015, 1:08pm
4
Collectd does not give me what I am looking for? It is a very basic output
What are you looking for?
Lewis
October 21, 2015, 1:23pm
6
Reports, Graphs, Hosts, Protocols, almost like ntopng… Have you seen the ClearOS report page…
1 Like
Jim
February 1, 2016, 3:56pm
7
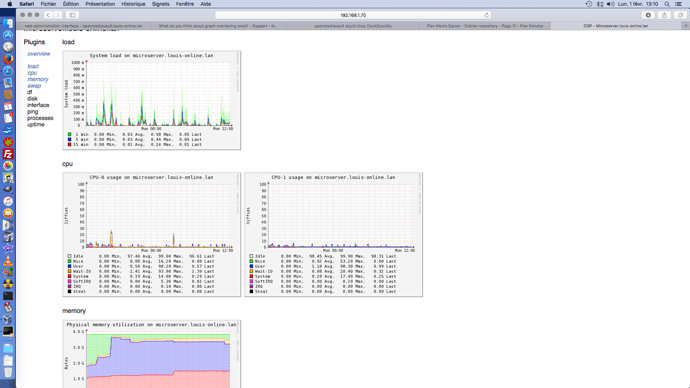
I was looking other stuff…
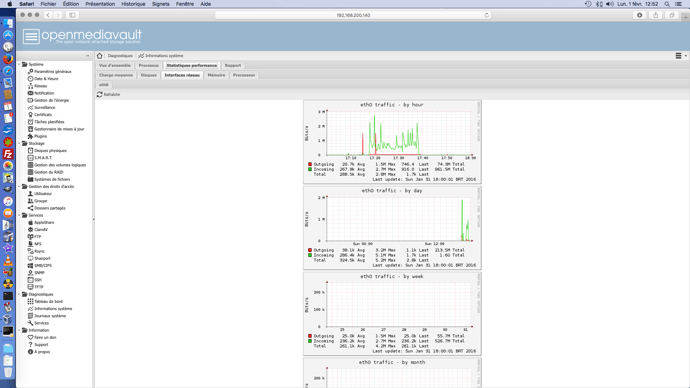
And openMediaVault too
Can we have some useful and well integrated graphs too?
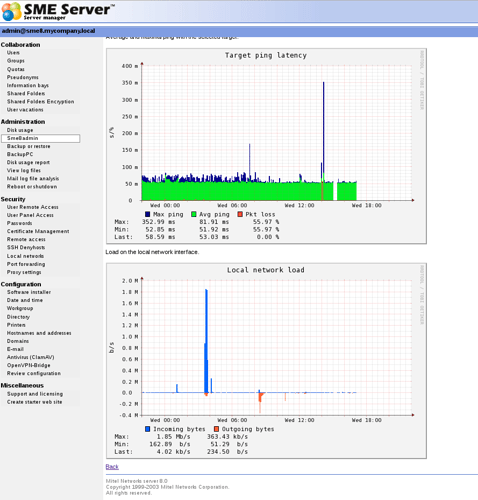
NethServer has lots of graphs.
Just to comapre network latency, here’s a screenshot:
Jim
February 1, 2016, 4:13pm
10
I know @filippo_carletti there are graphs
it lack few polishment to look well integrated, at least
Got it. And I agree. Personally, I’m not good with aesthetics, but I’d like to work on better integration.
robb
February 2, 2016, 11:56am
12
At Linuxschools we have Monitorix as a graphing tool for monitoring: http://www.monitorix.org/screenshots.html
zamboni
February 2, 2016, 12:18pm
13
I see the same graphics (i.e. generated from the same sw/libraries) just with different parals regarding formatting and used in differently styled pages
Jim
February 2, 2016, 6:55pm
14
Continuing the discussion from NethServer v7-alpha2 :
You can now start/stop/restart services from the web interface. What do you think @Ctek ?
Pretty nice integrated graphs. @Jim
Edit: Also, graphs are directly accessible from port 980, you don’t need anymore to forward port 80.
To celebrate this great news, and because it’s carnaval time here:
Enjoy
1 Like
Jim
February 9, 2016, 2:09am
15
For collectd…it’s done
Now, it’s time to give a pretty good look to ntopng
