Hi All
As promised earlier, here’s also a Testimonial for NethSec8 running on a VM in Proxmox.
The Testimonial for a hardware native install of NethSec8 can be found here:
For this Testimonial I installed a suitable VM in my Proxmox with the following settings:

Other than this, I followed the instructions here:
→ For LAB purposes, I have a vLAN (vlan99) simulating an Internet connection by a Provider.
This provides a 172.25.99.0/24 network, isolated from other LANs but with Internet.
NethSec8 WAN is connected to this, the LAN is connected to my LAN here.

Installation is very quick on Proxmox, even on a low powered Hypervisor.
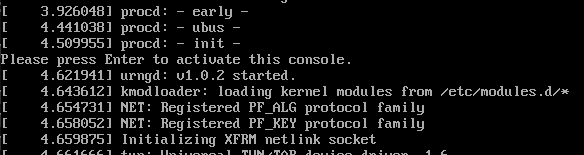
This is VERY irritating:

Waiting for the boot progress to finish, and a login to be displayed, so I can install qemu-ga…
Nothing happens…
Hitting any key will display the big secret:

Why not show this during any boot?
In any case, it did work.
Nice, clean Dashboard.

→ After firsst Installation, CPU Info would be nice (Cores, etc).
In the meantime, I am aware of the (for me VERY unusual “Bridge” concept) - so one of my first steps was to remove the bridge.
As this is a VM in Proxmox, and actually already backuped to PBS after the initial installation, AND the fact that this is not my actual Internet connection I am not having any risks…
The removal of the bridge did go straightforward - yes. But the WebGUI does not automatically refresh, like other such products - or even NS8. So the bridge is still displayed, with no NICs attached. After a while, it did dawn on me to refresh, and all appeared as expected.
→ The GUI must have a refresh function!!!
Now, as said, the dashboard does have a clean look and feel. But there’s NO Options to display what’s needed and used, and hide or not display what’s not needed or used.
For a lot of my clients, Hotspot is not usable. Fine.
So why can I not remove or hide it from the dashboard?
![]()
As an example:
Unifi also offers something similiar to ThreatShield, with an Opt-In Feature.
On the Dashboard, this is displayed:
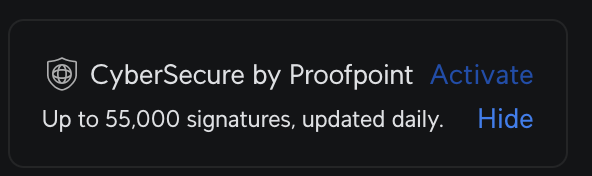
As soon as you Mouse-Over, the *Hide" button is displayed…
Note:
This does NOT advocate for CyberSecure by ProofPoint - Neither my clients nor I use this.
But I did want to show how such an Info can be displayed, yet also easily be “hidden” so as not to leave the impression of a “Nag” screen for something I do not want.
It can always be activated on the System/Security screen, then it displays as expected on the dashboard.
This would be a good idea how to implement something like this, with a simple conditional query in the dashboard programming… ![]()
The same should be valid for eg VPNs.
Modifing anything, unsaved changes…

The dashboard itself uses the red color to highlight important issues, so why not above too?
Blue is to “peaceful”, and as part of the GUI color, not very noticeable!
DNS is still unusable - at least on the GUI level.
Come on guys, even Unifi allows almost everything (except for CNAMEs, but even they are coming…)
MX, SRV, whatever.
But just “A” or “*” Records? Not enough!
Note: Even OpenWRT has more in their LUCI WebGUI for DNS…
All in all, NethSec8 has been doing good progress.
IMHO the major caveats are:
- Bad Screen (Login missing)
- Unresponsive Webpage (No automatic refreshing)
- Highlighting Warnings, etc in RED!
- Dashboard enhancements (Widgets, enabling, disabling, hiding)
- DNS is VERY lacking, not usable at all for a firewall, OpenWRT offers better…
- Wireguard still needs CLI configuration.
- Options for a local Hotspot are needed (No Cloud or External login and NO Social Media Logins!)
- Default Domain (.lan) needs to be changed.
Still, the whole package is rather expensive, when comparing to other firewalls.
And also, a lot of cases must be solved with CLI - this is not an “easy” firewall for beginners…
More warnings needed when activating services which entail high CPU usage.
Some users seem to like reusing old hardware, and suricata is one of the things which can easily lock down a low-powered weak box… No warning, even on very low powered hardware.
At least things ARE improving…
My 2 cents
Andy