So I signed up for a subscription a day or two ago, and today I’ve gotten some warning emails that don’t make much sense. I got a warning early this morning about system load, and a follow-up email a minute or two later saying it was OK, but then I got two later this morning that look like this:
The other was for the boot partition.
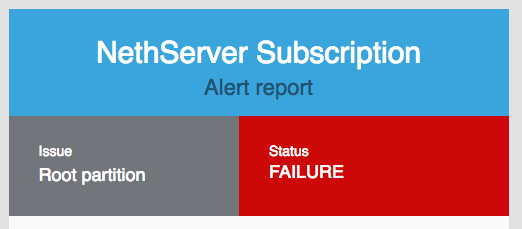
This looks serious, but what does it mean? The server was up and running at the time and remains so (40 days’ uptime right now), so clearly the root partition hasn’t actually failed. I logged into my dashboard, but there was nothing more there (other than that this was classified as “medium” severity, which hardly seems correct if the root partition had in fact failed). So how do I track down what triggered this warning?
I had the same behaviour at my tests. @giacomo supposed that it comes from a job like a backup. For me it wasn’t a backup, but my test-server hasn’t much resources, so I guess this was the problem.
Perhaps @giacomo can help to find out your other problem.
We just need change the something thing. I’d suggest this corrections:
Boot partition → Boot partition free space
Root partition → Root partition free space
SWAP partition → SWAP free space
You can find everything inside the /var/log/messages, something like:
/var/log/messages-20180107:Dec 31 06:09:30 nethservice collectd[18129]: [WARNING] load:load: Host nethservice.nethesis.it, plugin load type load: Data source "midterm" is currently 5.330000. That is above the warning threshold of 5.000000.
/var/log/messages-20180107:Dec 31 06:19:20 nethservice collectd[18129]: [OK] load:load: Host nethservice.nethesis.it, plugin load type load: All data sources are within range again. Current value of "shortterm" is 1.050000.
Alert rules are the same applied on thousands of active systems and usually they spots some existing problems.
Of course, not every machine is the same and threshold could be adjusted (we have it on the roadmap but I can’t give you any hint on when it will be available).
You can check load spikes looking at collectd graphs and logs at the time when the alert was active.
…which isn’t true; it’s about 60% empty (so over 350 GB free). And the boot partition, for which I received the same message, is 76% empty (690M free).
Hmmm, not so much. There’s one mention of threshold in the relevant log, and it’s about a load average. Nothing about disk space.
I’d suggest that the emails should be made much more specific: “At $TIME on $DATE, your server’s disk space was 86% full; the warning threshold is 85%.”