I had the same issue with my NS8 installation attempting to connect to stats.grafana.org. The instructions from @mrmarkuz worked for the initial install.
In the last few days I updated the loki container and now I am getting 2 connection attempts every second to the stats.grafana.org. Out of curiousity, why wasn’t this fixed applied in the update?
I followed the instructions from the post again today but it doesn’t work anymore. My NS8 server continues to attempt to connect to stats.graphana.org twice every second.
What else can be done to stop the connection attempts to this external site?
I have added 0.0.0.0 stats.grafana.org to the /etc/hosts file in an attempt to stop the dns from being spammed multiple times every second. I hope this fixes the issue.
I’m trying to reproduce the issue but without success.
Could it be that there are so much queries because you are blocking stats.grafana.org with pihole? Did you already try to allow stats.grafana.org in pihole?
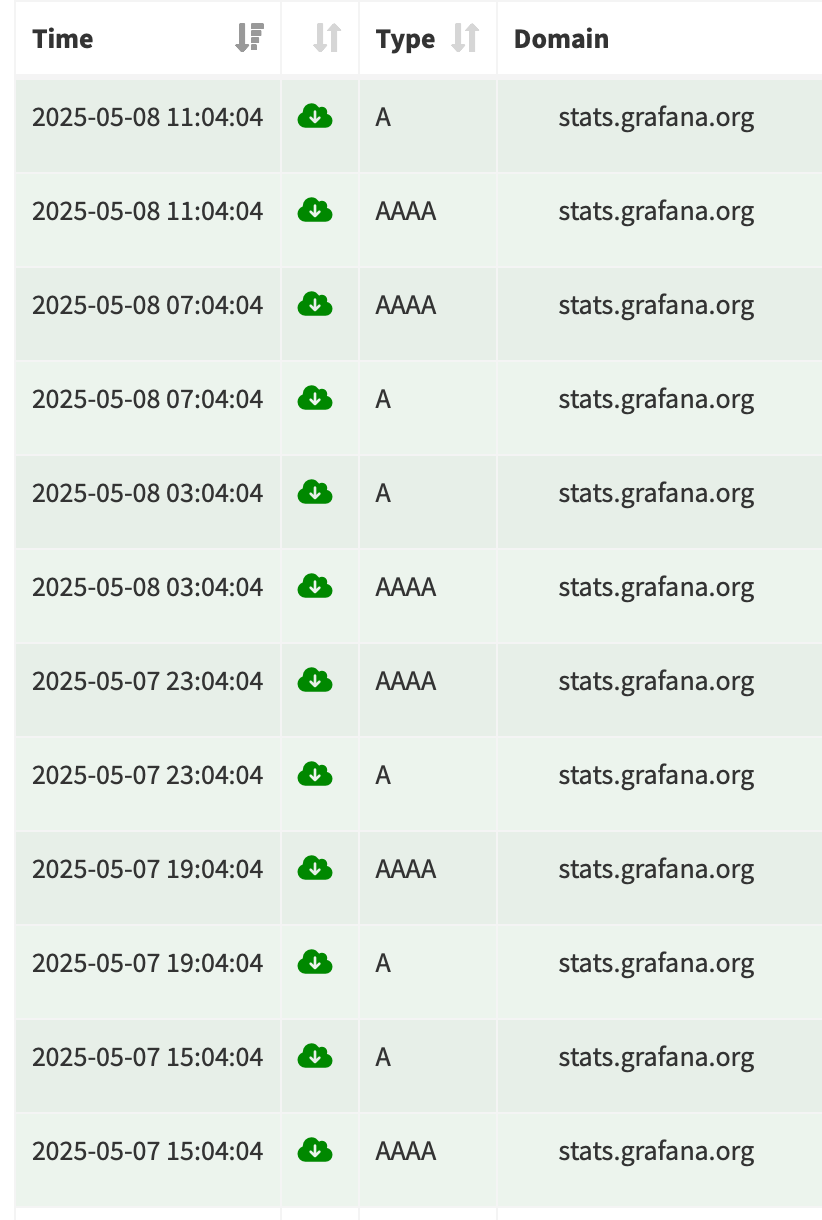
When I block stats.grafana.org in my firewall (NethSec) the queries occur 2 times in a minute per server. After releasing the block there are no queries anymore.
@capote I added the 0.0.0.0 to hosts file but it didn’t help. Then I rebooted my NS8 server and it still continues.
@mrmarkus it doesn’t make sense to me. If the stats.grafana.org is not blocked then there are no requests?
When you allow pi-hole to pass the connection, it won’t show up in the block list. This is expected. But that also means that the NS8 server is talking to stats.grafana.org even though the config says it isn’t supposed to be enabled. So yes, if you allow it in pi-hole it will continue connecting. But the point was not to allow it to share whatever data it is sharing to stats.grafana.org.
By default, Loki will send anonymous, but uniquely-identifiable usage and configuration
analytics to Grafana Labs. These statistics are sent to https://stats.grafana.org/
Statistics help us better understand how Loki is used, and they show us performance
levels for most users. This helps us prioritize features and documentation.
For more information on what’s sent, look at loki/pkg/analytics/stats.go at main · grafana/loki · GitHub
Refer to the buildReport method to see what goes into a report.
Yes that is correct. But I’m also concerned about what’s leaking out of the network. I’m a bit of a privacy nut, so I’m always checking the network. Then if I can’t identify it, I block it. Pi-Hole blocked this all by itself without my help.
With this issue, it just showed up when I did the update last week which included loki. So when I searched the forums, I saw that @capote was dealing with the same/similar issue and here I am.
OK, it looks like I should take out the line in the hosts file?? And allow grafana.org in pi-hole??
Now I see that pi-hole is also blocking icp-mta019.reportspam2abuse.sendlane.com. Aaaaaahhhh. What is this now?
A quick update. It was late last night and I didn’t get around to remove the line out of hosts file and didn’t allow stats.grafana.org. But this morning when I looked at pi-hole, my NS8 server is no longer listed as getting blocked. At some point overnight, it stopped connecting to grafana.org.