NS8 produces massive DNS-requests to this subdomain.
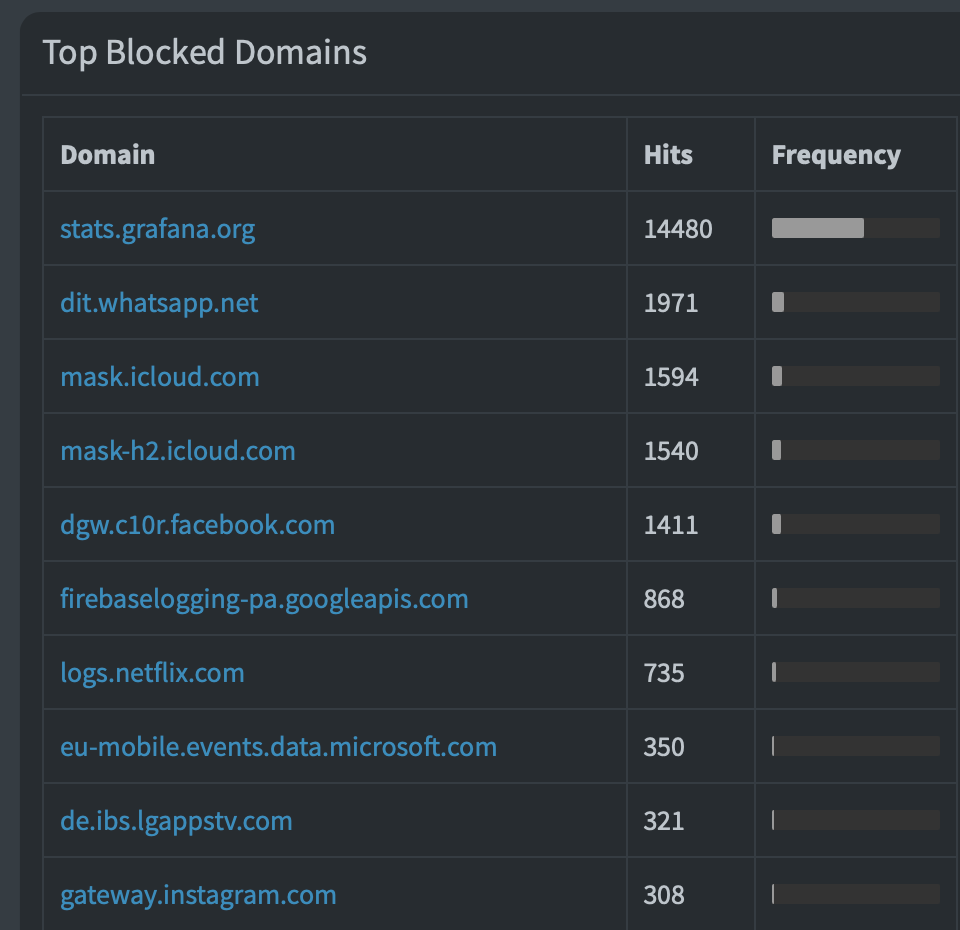
Is it possible to disable this behavior on the NS8-Server?
Ps.:
| core1 | Knoten 1 | 3.4.1 |
|---|---|---|
| ldapproxy1 | Knoten 1 | 1.1.0 |
| loki1 | Knoten 1 | 1.2.2 |
| samba1 | Knoten 1 | 2.3.0 |
| traefik1 | Knoten 1 | 2.2.5 |
NS8 produces massive DNS-requests to this subdomain.
Is it possible to disable this behavior on the NS8-Server?
Ps.:
| core1 | Knoten 1 | 3.4.1 |
|---|---|---|
| ldapproxy1 | Knoten 1 | 1.1.0 |
| loki1 | Knoten 1 | 1.2.2 |
| samba1 | Knoten 1 | 2.3.0 |
| traefik1 | Knoten 1 | 2.2.5 |
Do you have Grafana installed on the NS8?
It seems some of it’s plugins want to send usage stats. It could also be loki…
EDIT:
Here are methods for disabling it for loki:
Thank you Markus
No, I don’t have installed Grafana.
As workaround I added 0.0.0.0 stats.grafana.org to /etc/hosts.
@davidep @stephdl
The dev’s should disable it by default. I am surprised that such a long-known mistake has not been corrected in the meantime.
Sincerely, Marko
It can be disabled in loki:
runagent -m loki1
Edit loki config file:
nano ../loki-config.yaml
and add following content after auth-enabled: false:
analytics:
  reporting_enabled: false
  usage_stats_url: ""
Restart loki-server:
systemctl --user restart loki-server
I had already tried this also in the meantime.
root@daho-ns8:~# runagent -m loki1 podman exec -ti loki-server vi /etc/loki/local-config.yaml
But the loki-config.yaml is write-protected.
runagent -m loki1 podman exec -ti loki-server ls -sla /etc/loki/local-config.yaml
     4 -rw-r--r--    1 root     root          1835 Nov  5 07:46 /etc/loki/local-config.yaml
You’re running it from inside the container.
The loki container by default doesn’t login as root user when using podman exec. You could use podman exec -ti --user 0:0 loki-server sh to enter as root, then the file should be writable.
But that’s not necessary, the config file is in /home/loki1/.config/loki-config.yaml, it should work as in the instructions I posted.
In one line:
runagent -m loki1 nano ../loki-config.yaml
Ahhhh. Thank you!
So I was almost on the right track. But only almost. ![]()
I summarize:
runagent -m loki1 nano /home/loki1/.config/loki-config.yaml
auth_enabled: false

analytics:
  reporting_enabled: false
  usage_stats_url: ""
Restart loki-server:
runagent -m loki1 systemctl --user restart loki-server
You’re welcome, please report if it worked.
It was the right way but this is a special case.
I can confirm, it works.
same problem here but the workaround leads to
File “/usr/local/bin/runagent”, line 92, in
os.execvp(args.COMMAND, [args.COMMAND] + args.ARGS)
File “”, line 574, in execvp
File “”, line 616, in _execvpe
File “”, line 607, in _execvpe
FileNotFoundError: [Errno 2] No such file or directory
any other ideas?
and now, the problem is back
I added …
analytics:
  reporting_enabled: false
  usage_stats_url: ""
…again and only left out auth_enabled: false, because it is already in the first line
same error here, insane dns questions like i post in this link:
Why are you using IPv6 for this query?
Or you’re not aware your server is partially using IPv6?
My 2 cents
Andy
I corrected my post as it was misleading.
@hucky please try this to get rid of the queries: NS8 >> stats.grafana.org - #4 by mrmarkuz
i had to reverse this to get logs working again in the cluster_admin after the last core (3.6.0) update
at my side, with the workaround from post #4 it did not work, grafana spams again my protokoll
| 2025-05-04 12:47:37 | A | stats.grafana.org | sogo.domain.de | 4.5 µs | ||
|---|---|---|---|---|---|---|
| 2025-05-04 12:47:37 | AAAA | stats.grafana.org | sogo.domain.de | 11.4 µs | ||
| 2025-05-04 12:47:29 | A | stats.grafana.org | sogo.domain.de | 4.1 µs | ||
| 2025-05-04 12:47:29 | AAAA | stats.grafana.org | sogo.domain.de | 11.4 µs | ||
| 2025-05-04 12:47:27 | A | stats.grafana.org | sogo.domain.de | 5.0 µs | ||
| 2025-05-04 12:47:27 | AAAA | stats.grafana.org | sogo.domain.de | 12.4 µs | ||
| 2025-05-04 12:47:25 | A | stats.grafana.org | sogo.domain.de | 4.5 µs | ||
| 2025-05-04 12:47:25 | AAAA | stats.grafana.org | sogo.domain.de | 11.4 µs |
same at me. I assume that the adjustments will be overwritten during updates.
i did the same again how @mrmarkuz described it at #4 but it does not work
It works for me. The DNS-requests stops.
loki1@daho-ns8:~/.config/state$ cat ../loki-config.yaml
auth_enabled: false
analytics:
  reporting_enabled: false
  usage_stats_url: ""

server:
  http_listen_port: 3100
...
...
...
@capote thank you, will have a look at it, maybe i had an error.
