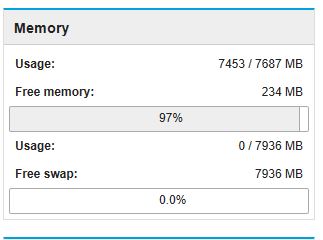
I have a problem with memory usage. The available memory is used up to 234 MB, as you can see on the picture. Which command can I use to show the memory usage of each application?
Mail with Webtop, Nextcloud, Mattermost, Dokuwiki and Ejabberd are installed on the server.
Remember that linux just will grab what it can use. If there is 8GB ram available, it will use it. It will become a problem if it constantly exceeds the available amount if ram and starts swapping. https://www.centos.org/docs//2/rhl-cg-en-7.2/memory-usage.html
That’s not available memory, that’s free memory. I suggest you use atop and free -h to monitor your RAM.
Install atop:
yum install atop
Run atop:
atop 5
By default it will show your system process CPU consumption, to show RAM usage press key M and then SHIFT+M, this will show you a list of processes ordered by RAM, column RSIZE will give RAM usage by each process.
Also this command
free -h
Will give your system available memory under column available, memory used will be total - available.
Also used column is sum of all process used memory, is not equal to total - available because system also use slab, buff, and other types of memory.
Being an Arch Linux guy too i’m used to have a 100% memory usage. Arch Linux just tries to cash whatever it can and drops it if memory is allocated elsewhere. Why worry about it?
This being said I hope the new web-ui cockpit does a better Job than we have now.
Or should it be improved in the server-manager we have now?
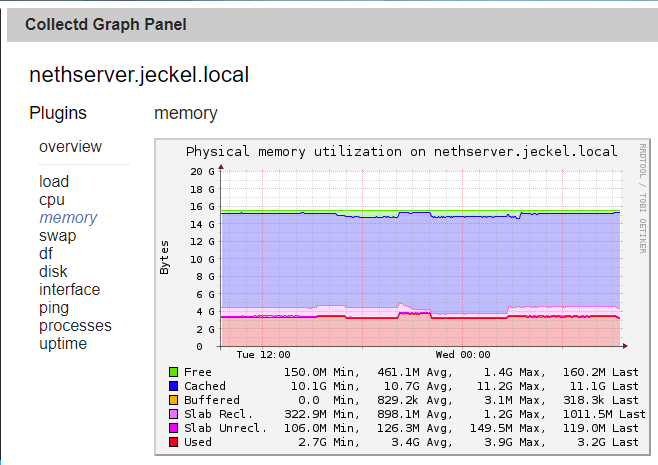
You can use “statistics module” to show your memory-usage.
Most of the ram of this machine is cashed, so it’s available for use if needed, but used for chaching if not needed for apps. Following the priciple “unused (free) memory is useless memory”.
This question/issue comes around quite often. IMHO the cause is because the memory info on the dashboard is not very meaningful maybe even a bit misleading.
We have learned now memory management in linux is to complex to be shown in one simple bargraph.
However I think we can do a better Job:
The widget on the dashboard reads memory info from /proc/meminfo:
A general conversation regarding the bars in widgets better be donean new topic.
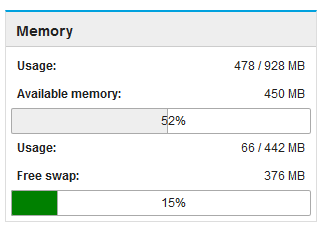
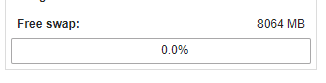
Funny: I never “connected” the label to the bar-graph. (ie) For me “Free swap:” is the label for “376 MB” not for the graph beneath it.
I think you are right that the “Available” is connected to the amount of GB/MB/GB on the right side of the widget.
To avoid misinterpretation, the bar graph should not only say “xx%” but better would be “xx% used”.
As I saw what incredible improvement the dev_team with is doing cockpit-Ui, I think these minor things in standard UI are not the most important on the list.
But your idea of a little line wouldn’t be much work to realize.

 sry guys