Good community,
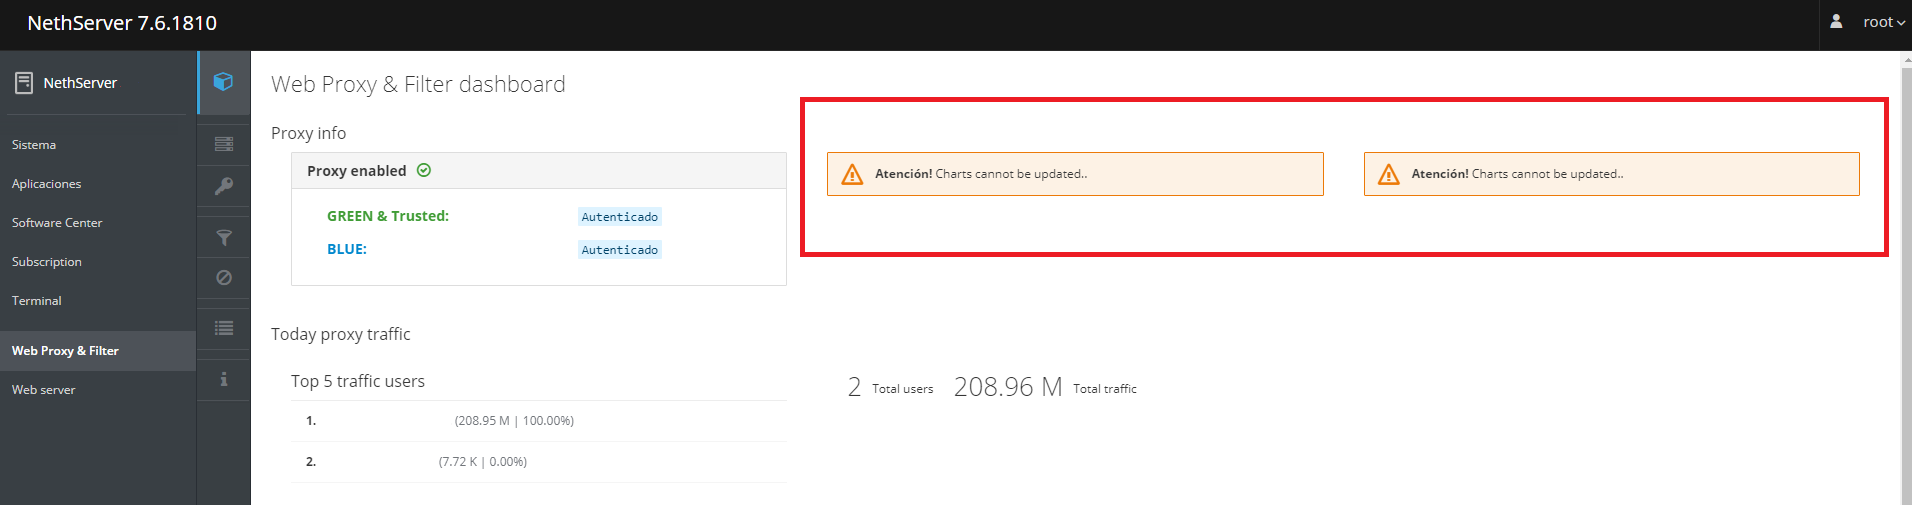
I don’t know why the two graphs that I indicated in the capture of the web proxy dashboard don’t work, can you tell me why it can be?
Thank you!
Good community,
I don’t know why the two graphs that I indicated in the capture of the web proxy dashboard don’t work, can you tell me why it can be?
Thank you!
Same here.
You need to have nethserver-netdata installed.
Shouldn’t it be installed automatically or the captures shouldn’t be shown, if not installed?
This is only my opinion, but I think people are embarrassed by such an error message.
Netdata is a monitoring system and impact system performances, this is why is not installed by default.
We could even require it if nethserver-cockpit is installed, but I’m not sure is the safest choice.
For sure we can improve the current label with something similar to this one used inside the firewall.
Anyone willing to open a PR? ![]()
I thought about removing the graphs fully if netdata is not installed.
Use a bandaid big enough to fit the wound, please…
Charts cannot be updated. Maybe Netdata not running or not installed
This is a against about usability rules we used on the whole cockpit development: do not hide elements if not available, but use empty states to highlight the missing content.
More info here: https://www.patternfly.org/v3/pattern-library/communication/empty-state/
So should we go with a better label or with forced netdata install?
My point for “better label”. If someone wants graphs can install the right package.
I think a better label is the right way I would label it
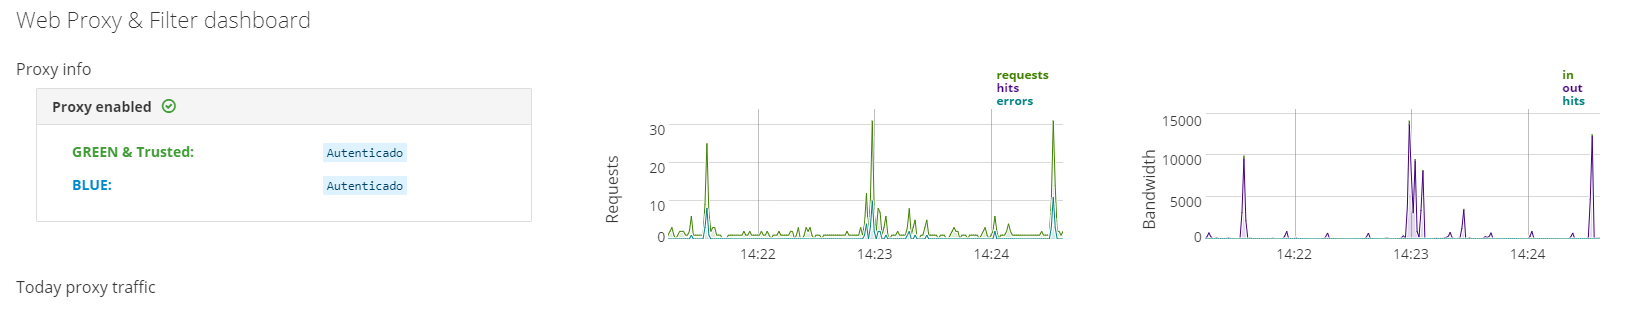
For showing Requests you have to install netdata.
and
For showing Bandwidth you have to install netdata.
I’m waiting the PRs! 
@dnutan is your man: he already did the PR!
Everything is merged and released. The package will be soon available to the mirrors.
And what was the solution made, since today June 1, 2023, there is no answer on how to solve it
The solution was to add a more descriptive label: