One thing I love on NS is the NTOPNG, just one question, when I was using ClearOS I had to install ntop, which I run it on the command line then went to the browser to view the report/traffic. On the ntop when you viewed IP > Traffick you had a sent and received column, you could view how much was sent and how much was received, I noticed that in ntopng if i click on host i only have a traffic column that combines both… Is it possible to view sent and received separate?
Hi Lewis, you can see as weel separate data on ntopng: just go to “Hosts”, select a sigle host by clicking in the first column from the left and go to “Traffic” tab almnost at the top of the page on the left side.
You will see sent and received traffic separate in tcp, udp and icmp protocol.
3 Likes
Whoah! Happy to have such new guy around  he’s our firewall/gateway expert, thanks @davide_marini
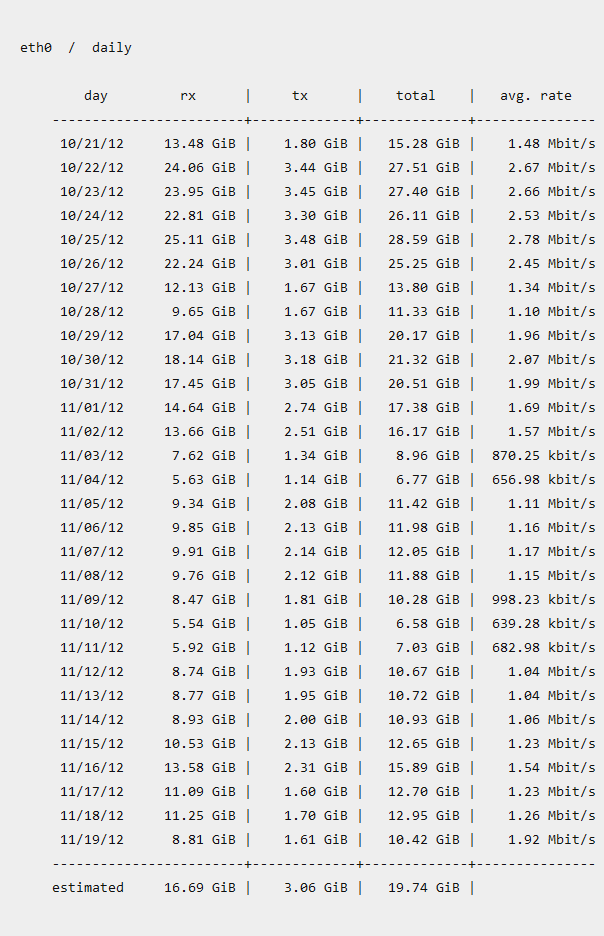
Thank you @davide_marini for the info, so if I have 20 hosts I will have to go into each host and calculate the received/download? Having a firewall and gateway is so we know what is going through and how much, wouldnt it be nice to have something like vnstat so we can see a daily amount of traffic like;
Hi Lewis, I understand your point of view, but AFAIK ntopng at the moment don’t have this option.
IMHO the actual view could be equally useful because tipically:
- I order hosts by Traffic ot Throughput
- if I see something “strange” I look in the “breakdown column” and I can have immediately an idea if the main part of the traffic is sent or received, only if I need further details I have go to the single host section, but usually I’m not forced to do it
Ntopng could have a different panel with the information you need that I don’t know, if you need that information probably you’d better ask in the ntop mailing list.
2 Likes