Hi,
Is there a way (or possibility to implement) to see the used and available space on destination local storage pls? On top of that, is there a way to set an alert when max (or set capacaty is almost reached.?
TIA
Hi,
Is there a way (or possibility to implement) to see the used and available space on destination local storage pls? On top of that, is there a way to set an alert when max (or set capacaty is almost reached.?
TIA
Check disks/partitions to find your local disk:
ls /dev/disk/by-id/
Get used/available space:
df -h /dev/disk/by-id/scsi-0QEMU_QEMU_HARDDISK_drive-scsi1-part1
As regards alerting, I think it’s possible but needs to be implemented.
Additionally to checking the host disk usage it should be possible to check the usb disk like:
(node_filesystem_avail_bytes{mountpoint="/mnt/usb"} / node_filesystem_size_bytes{mountpoint="/mnt/usb"})
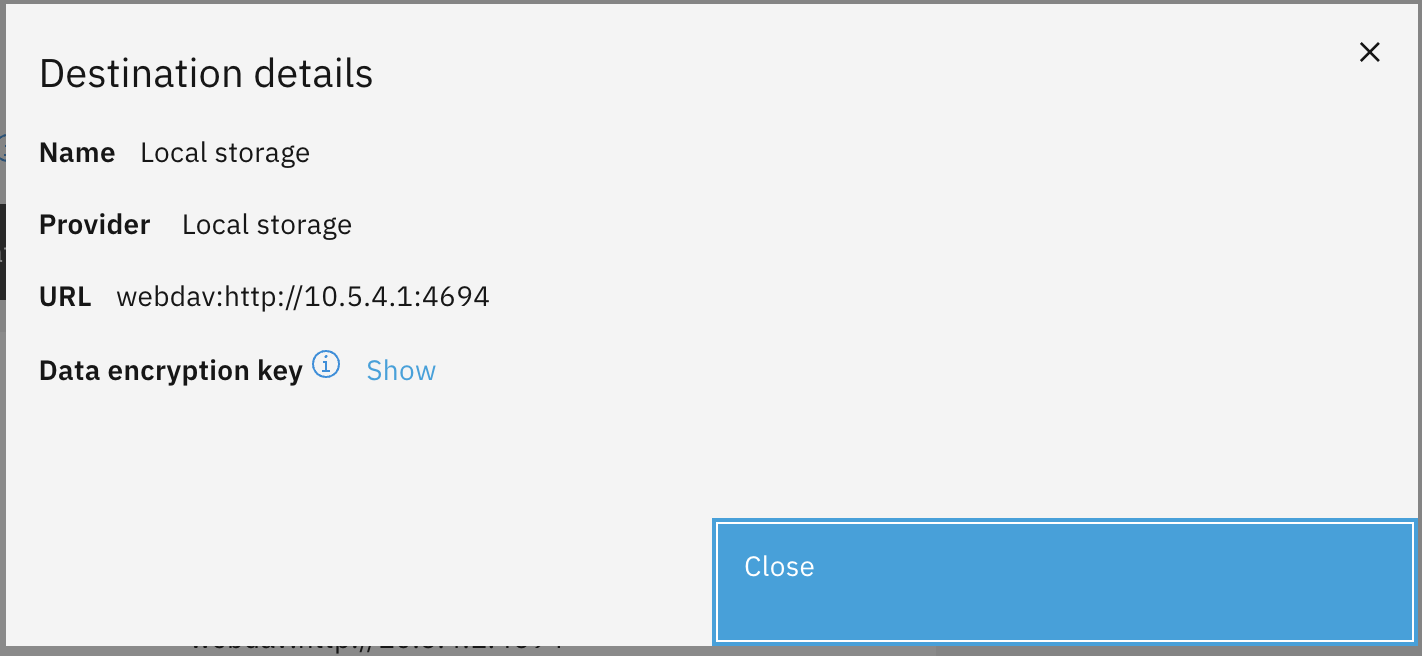
Thanks. I am wondering if it would be possible to see it on below screen in future releases
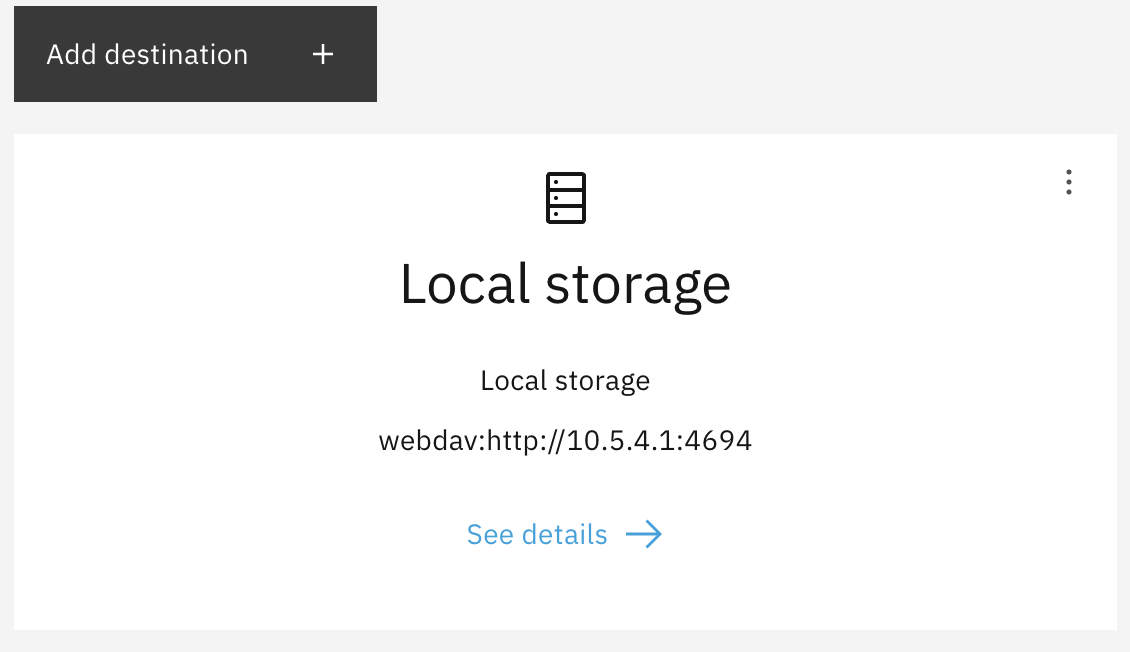
or even on the first screen:
Since we now have Grafana installed and active by default under settings (Metrics), can we use it for this purpose?
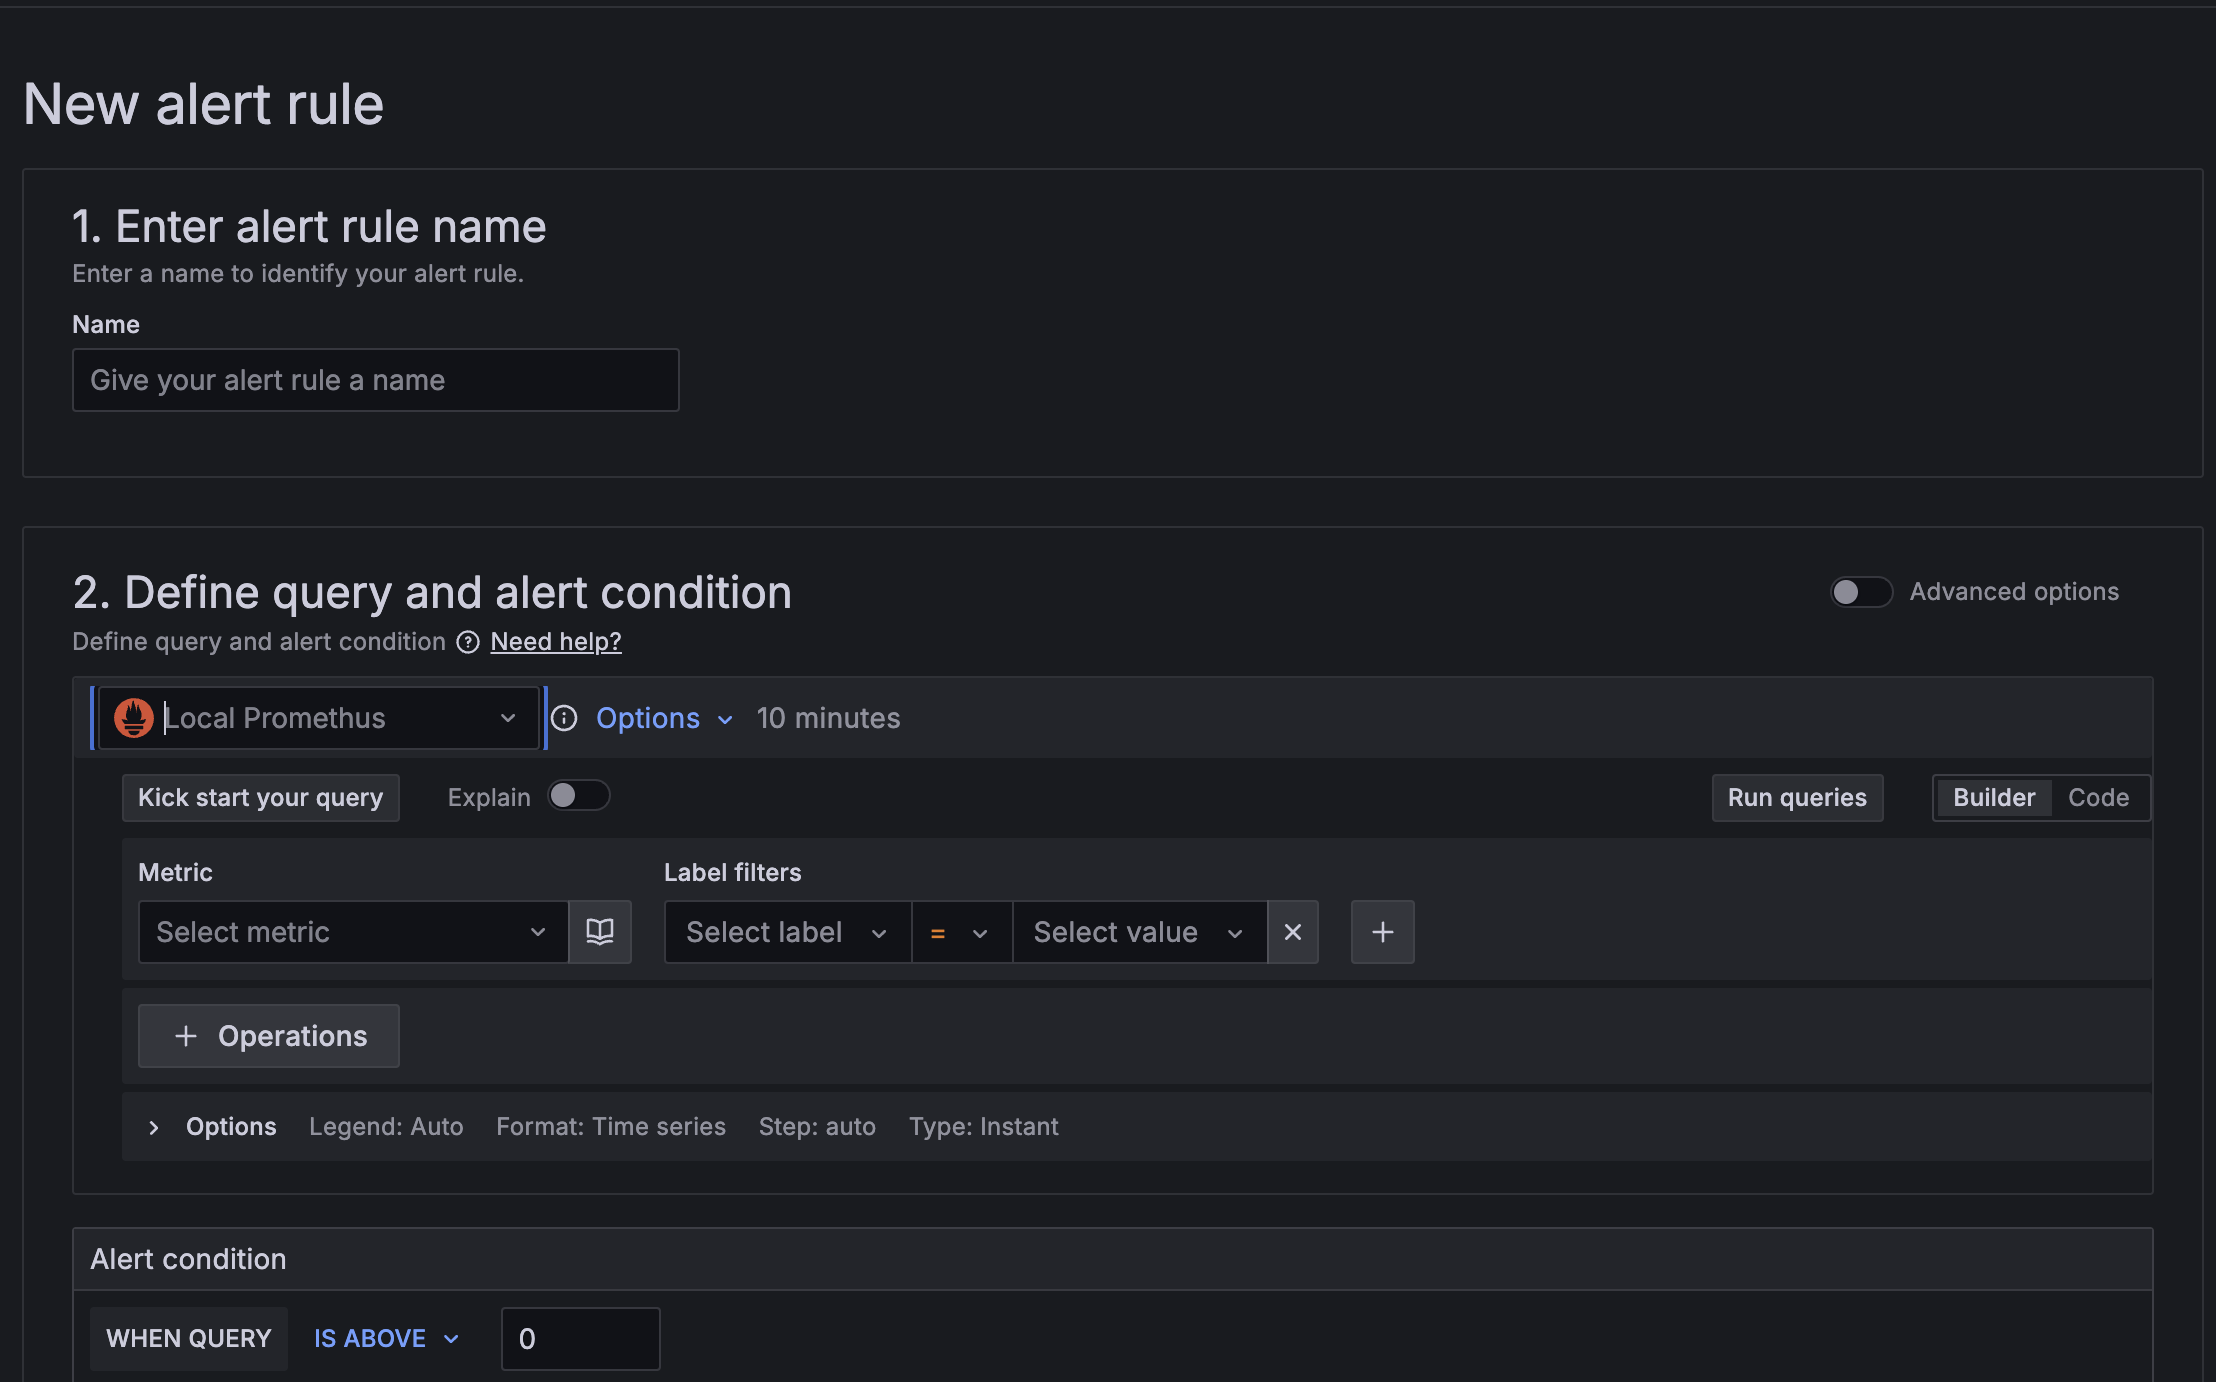
Could somebody show or create an alert for local storage (or any destination) capacity and share the prcedure (or can alerts/filters/dashboards be exorted/imported?) please?
TIA
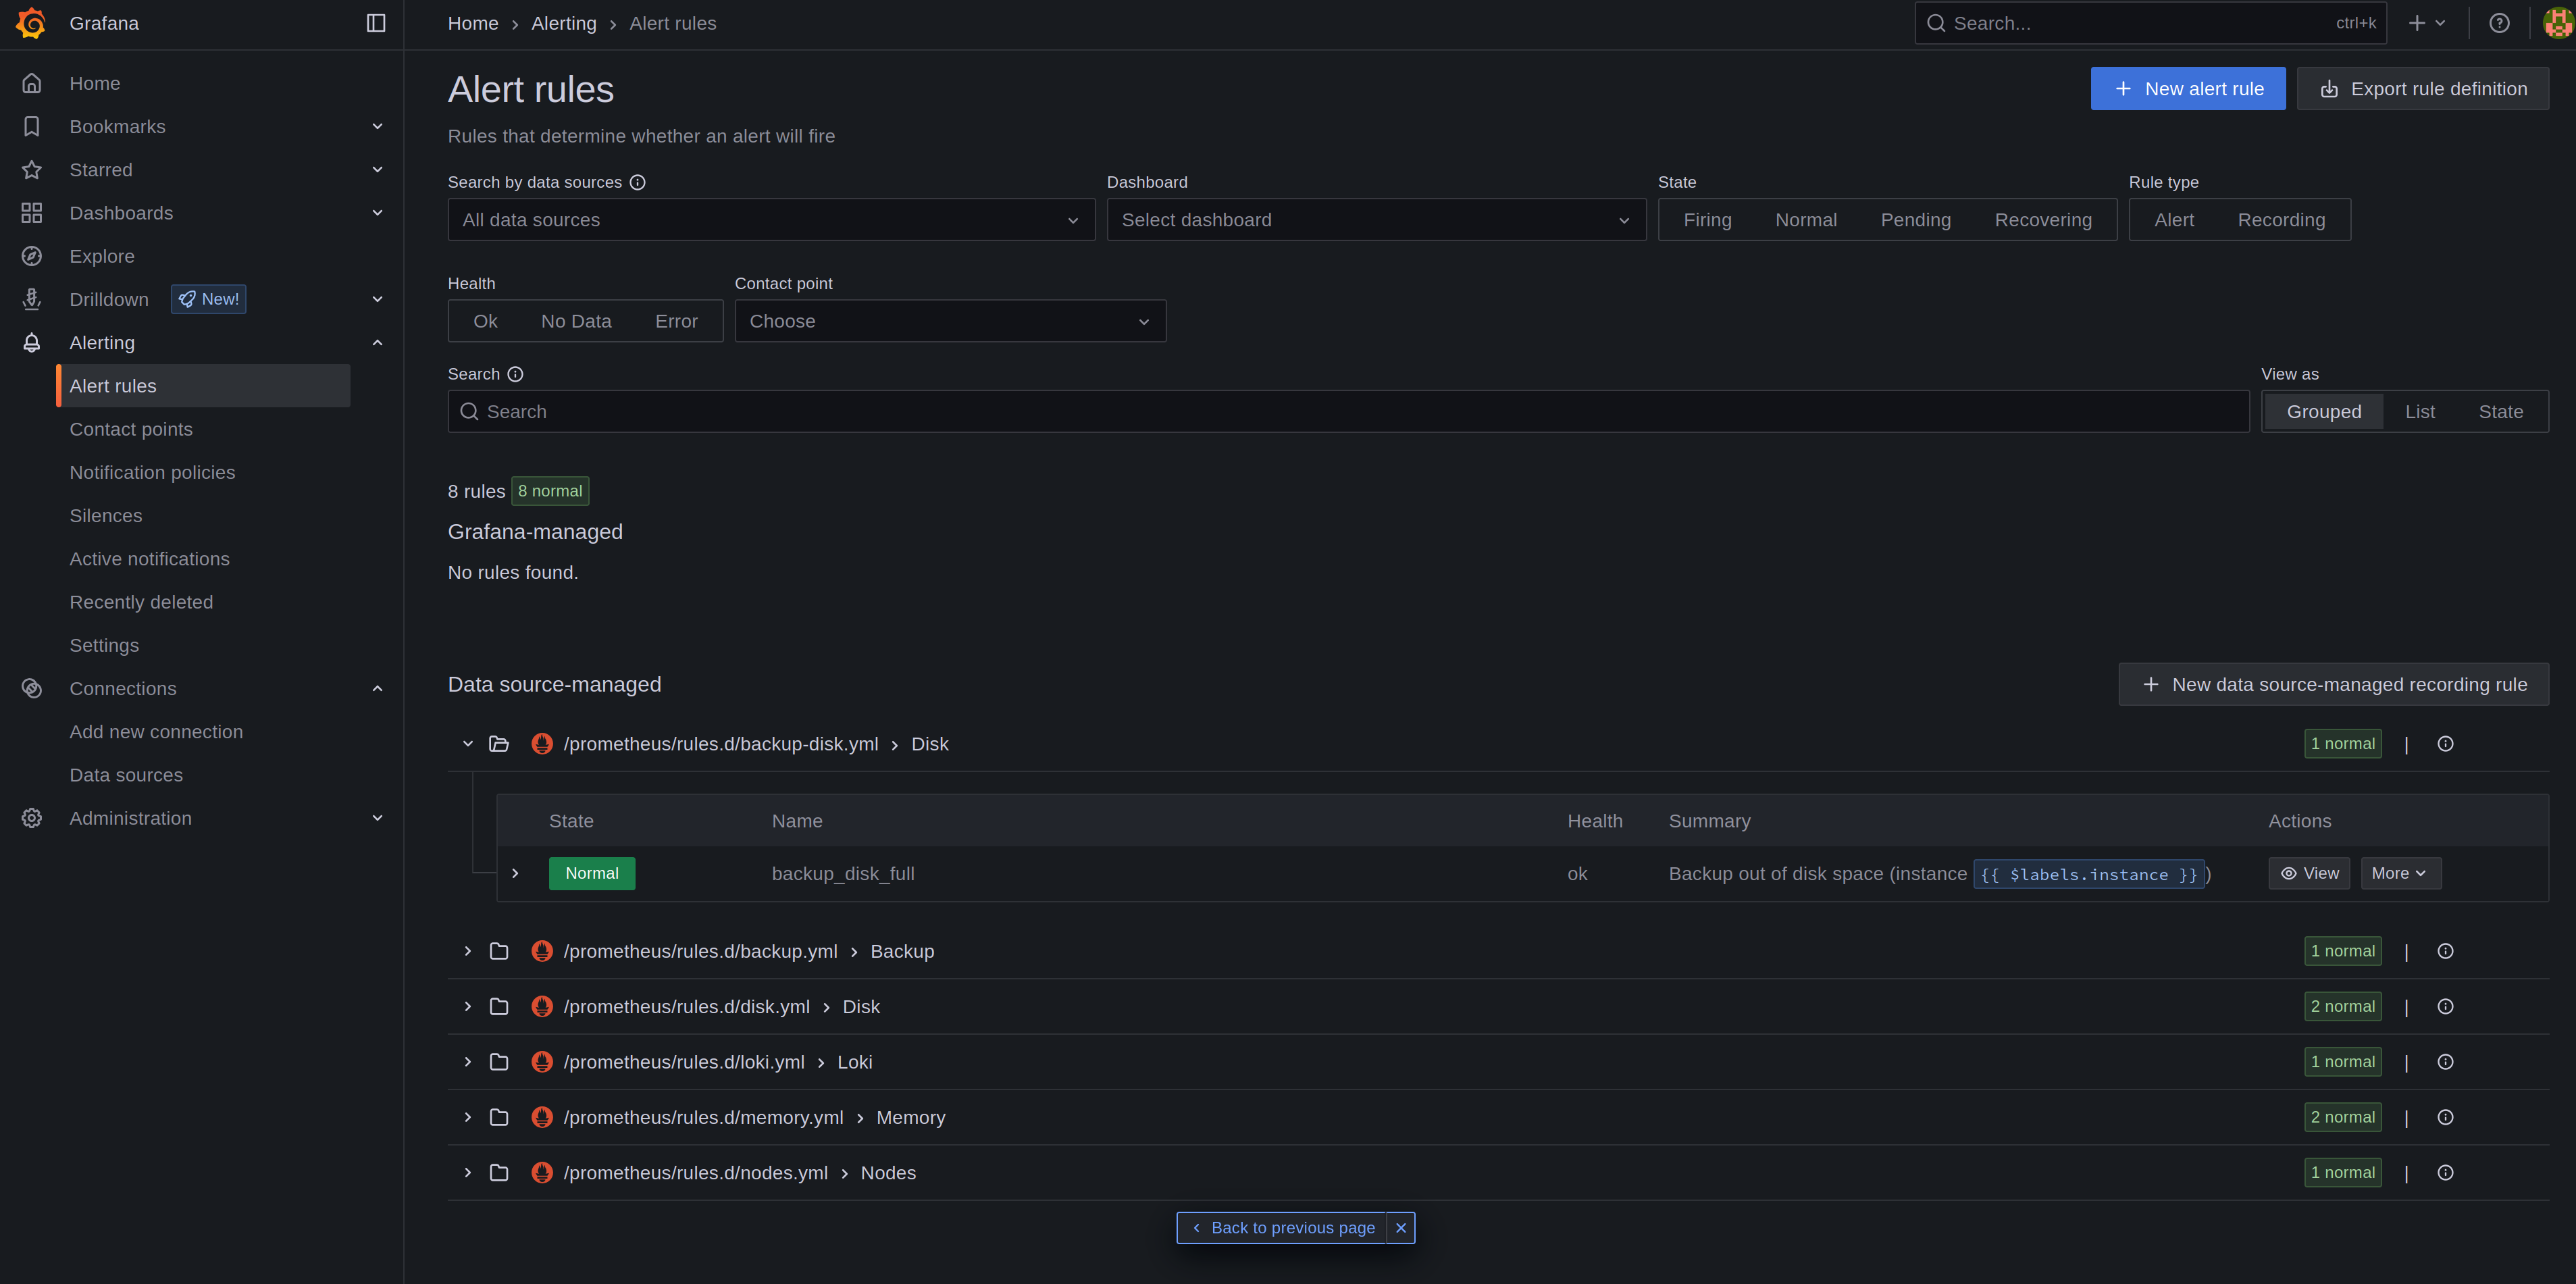
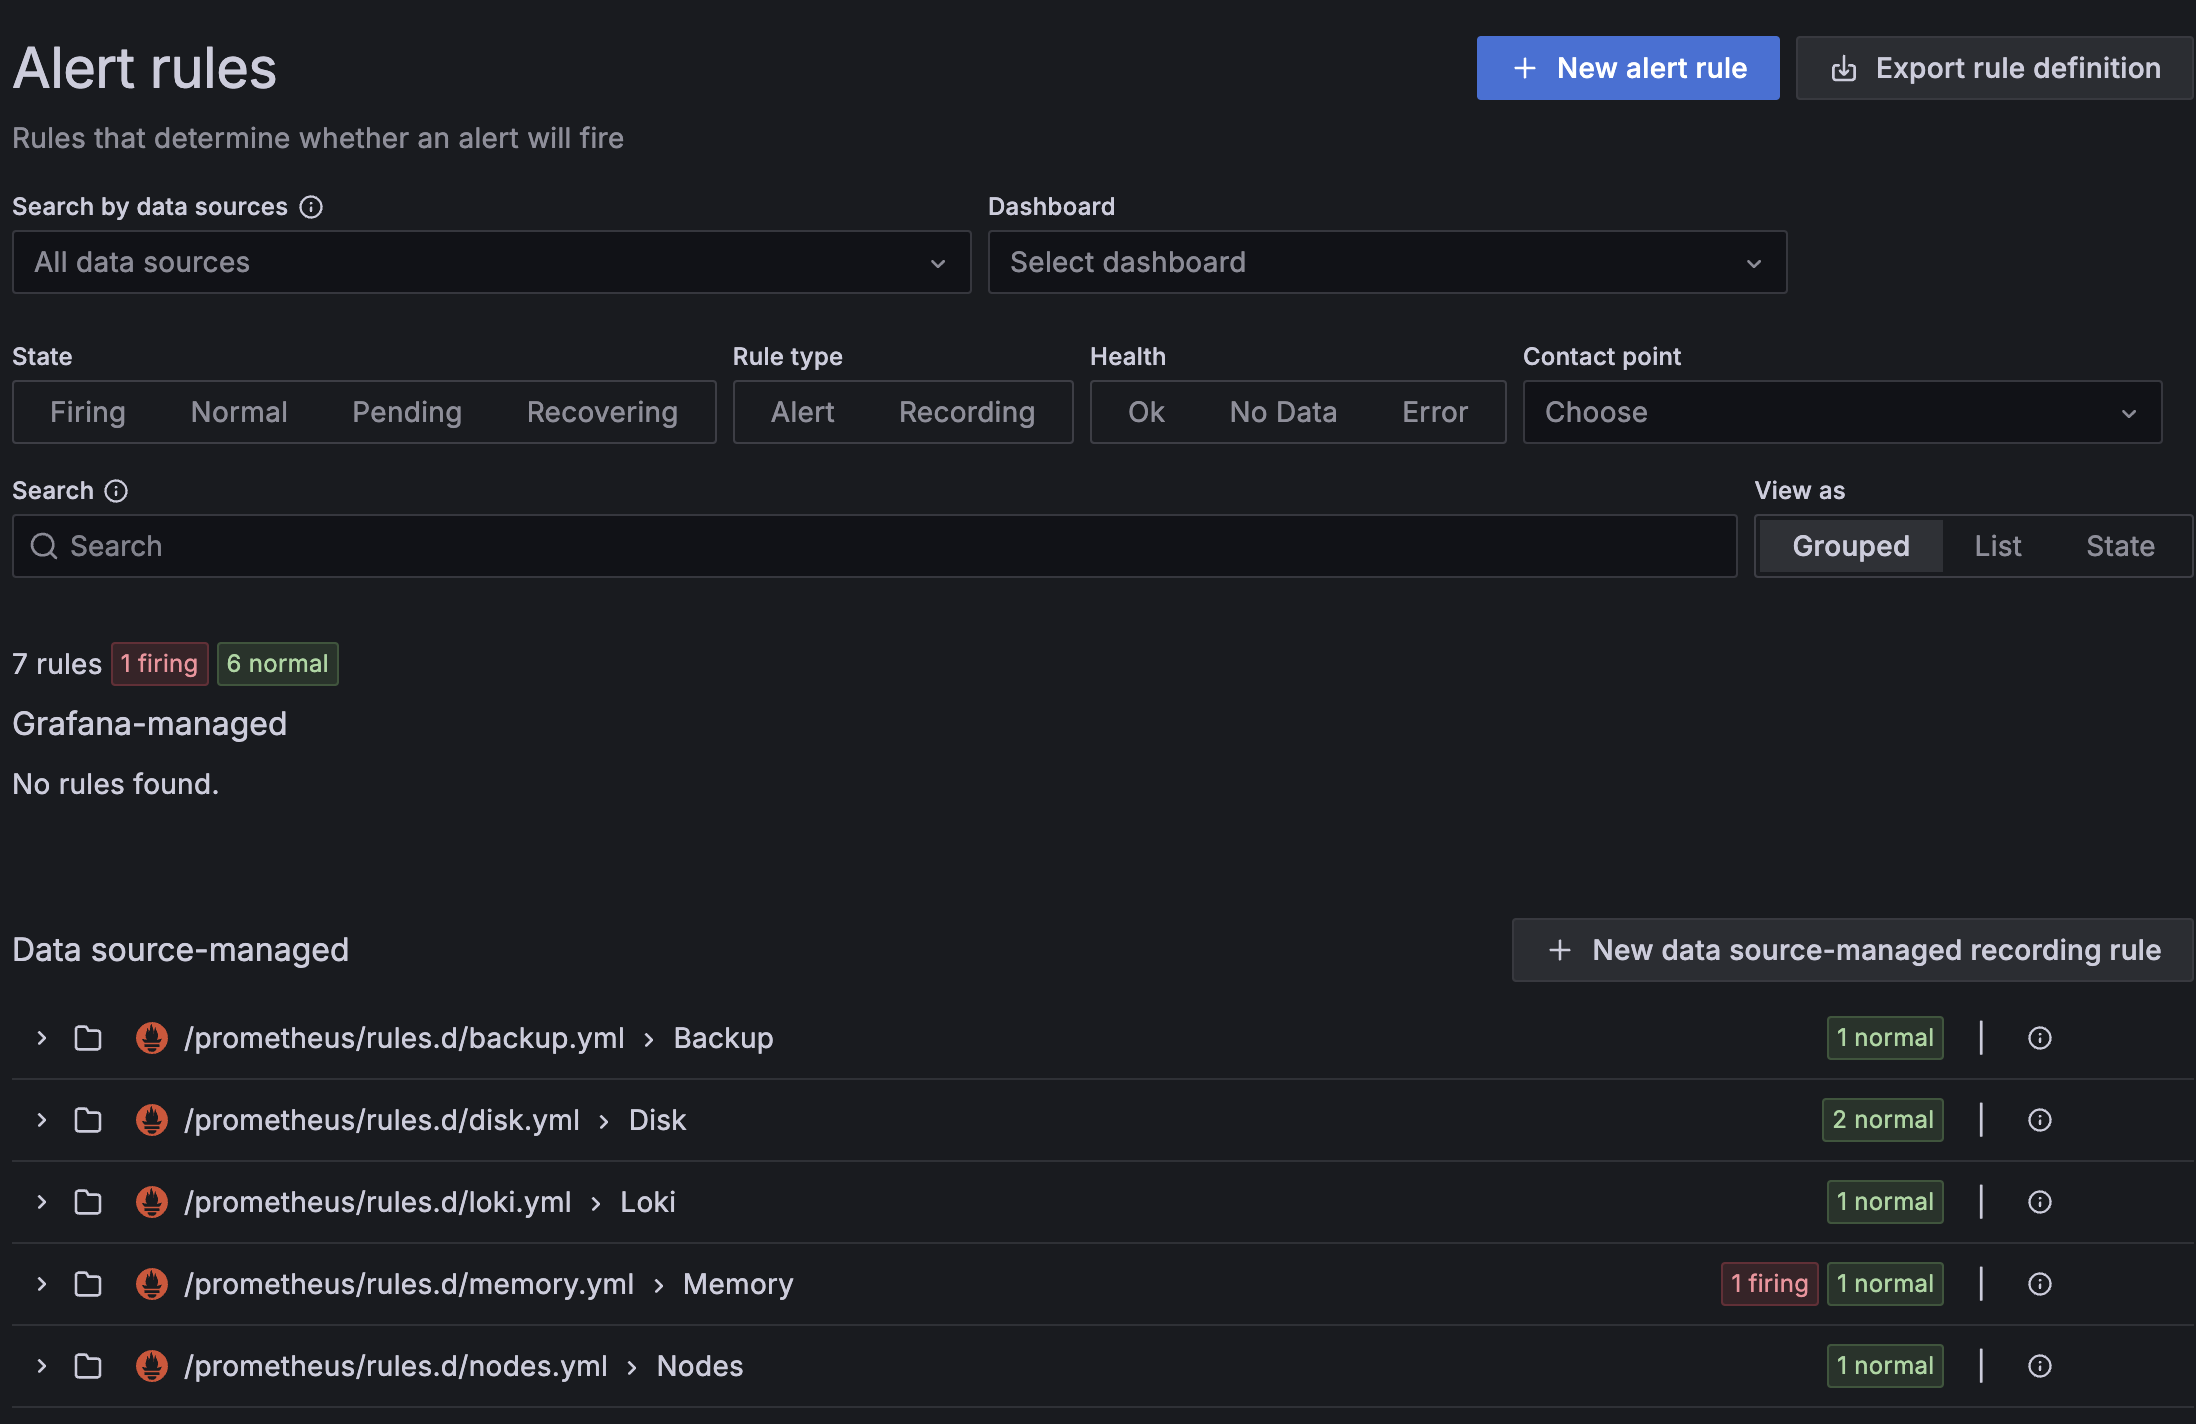
I tried to add following rule in rules.d/backup-disk.yml
groups:
- name: Disk
  rules:
  - alert: backup_disk_full
    expr: (node_filesystem_avail_bytes{device="/dev/sdb1",fstype="xfs",mountpoint="/var/lib/containers/storage/volumes/backup00/_data"} / node_filesystem_size_bytes{device="/dev/sdb1",fstype="xfs",mountpoint="/var/lib/containers/storage/volumes/backup00/_data"} < .10)
    for: 2m
    labels:
      severity: warning
    annotations:
      summary: Backup out of disk space (instance {{ $labels.instance }})
      description: "Disk is almost full (< 10% left)
  VALUE = {{ $value }}
  LABELS = {{ $labels }}"
Restart the services:
systemctl --user restart prometheus alertmanager alert-proxy grafana
It’s shown in Grafana but even after filling the disk space to 95% there’s no alert. I think the challenge is to get the right disk.
To be continued…
Did you creat ‘backup-disk.yml’ manually, for I have an existing backup.yml?
OR
Did you use the GUI to create the new alert?
or edited or created a data source-managed?
TIA
I created it manually on cli. (copied disk.yml and adapted it)
The existing backup.yml checks if the backup worked.
The default contact point (grafana-default-email) is an example. Maybe you have to set it to a real email address to get notified by email?
edit: Then again, what do I know. I have watched the online course and still have no clue..
I added the local backup disk to /etc/fstab (just for testing as it should be mounted by the podman volume) and restarted the metrics services and it worked. Even the default disk check triggered an alert when I put a big file to the backup volume.
So it’s basically working but needs to be configured to get data from the local backup disk.