Troubleshooting High I/O Wait affected the CPU

NethServer Version: NethServer release 7.4.1708 (Final)

Hi All,
I have found high IO Wait in my Collectd Graph Panel as you can see in the next image.

top - 18:45:58 up 22 days,  6:35,  1 user,  load average: 3.00, 3.04, 3.05
Tasks: 229 total,   1 running, 228 sleeping,   0 stopped,   0 zombie
%Cpu(s):  0.3 us,  0.3 sy,  0.0 ni, 49.8 id, 49.5 wa,  0.0 hi,  0.0 si,  0.0 st
KiB Mem :  5937944 total,   569632 free,  2990360 used,  2377952 buff/cache
KiB Swap:  6160380 total,  5862224 free,   298156 used.  2416072 avail Mem

How can I identify the offending process that generates Wait-IO?

Thanks in advance,
Pasquale

please, give us more info about your setup, starting from the hds, controller, raid setup

you’d try, IIRC, iostat

hi Stefano,
this is the output of iostat

[root@gateway ~]# iostat -xm
Linux 3.10.0-693.11.6.el7.x86_64 (gateway.domanin.xxx)    02/06/2018      _x86_64_        (2 CPU)

avg-cpu:  %user   %nice %system %iowait  %steal   %idle
           0.94    0.01    0.51    6.51    0.00   92.02

Device:         rrqm/s   wrqm/s     r/s     w/s    rMB/s    wMB/s avgrq-sz avgqu-sz   await r_await w_await  svctm  %util
sda               0.01     0.26    0.34    7.25     0.01     0.05    17.06     0.34   45.14    5.31   47.03   3.04   2.31
dm-0              0.00     0.00    0.34    6.89     0.01     0.05    17.74     0.37   51.69    5.42   53.98   3.19   2.31
dm-1              0.00     0.00    0.01    0.08     0.00     0.00     8.04     0.02  245.60    7.81  283.88   0.38   0.00
sdf               0.00     0.00    0.00    0.00     0.00     0.00   354.93     0.00   18.81    2.93   25.03  18.38   0.00
dm-2              0.00     0.00    0.00    0.00     0.00     0.00   393.69     0.00   22.22    3.09   26.57  21.69   0.00

[root@gateway ~]# iostat -N
Linux 3.10.0-693.11.6.el7.x86_64 (gateway.domain.xxx)    02/06/2018      _x86_64_        (2 CPU)

avg-cpu:  %user   %nice %system %iowait  %steal   %idle
           0.94    0.01    0.51    6.53    0.00   92.01

Device:            tps    kB_read/s    kB_wrtn/s    kB_read    kB_wrtn
sda               7.59         8.78        55.98   16918856  107912002
centos_gateway-root     7.23         8.56        55.58   16499735  107139729
centos_gateway-swap     0.09         0.05         0.30      96652     578224
sdf               0.00         0.01         0.27      22217     514976
centos_gateway_iscsi-data     0.00         0.00         0.13       5216     258558

you missed my request… disks, raid layout, ram… which kind of services… and so on

I’m sorry I missed it.
I have two disks, one of which is iscsi. no raid configuration. Active services are dns, dhcp, mail, spam, ftp, vpn, firewal, isp, webserver, database, antivirus, ldap and backup.

[root@gateway ~]# lsblk
NAME                          MAJ:MIN RM   SIZE RO TYPE MOUNTPOINT
sda                             8:0    0 465.8G  0 disk
├─sda1                          8:1    0   500M  0 part /boot
└─sda2                          8:2    0 465.3G  0 part
  ├─centos_gateway-root       253:0    0 459.4G  0 lvm  /
  └─centos_gateway-swap       253:1    0   5.9G  0 lvm  [SWAP]
sdf                             8:80   0   500G  0 disk
└─sdf1                          8:81   0   500G  0 part
  └─centos_gateway_iscsi-data 253:2    0   500G  0 lvm  /data
sr0                            11:0    1  1024M  0 rom
[root@gateway ~]# free -m
              total        used        free      shared  buff/cache   available
Mem:           5798        2967         474         158        2357        2304
Swap:          6015         291        5724

My only suspect is related to the backup module.
In the last days, I received some notification emails from the system indicating that another backup was in progress.

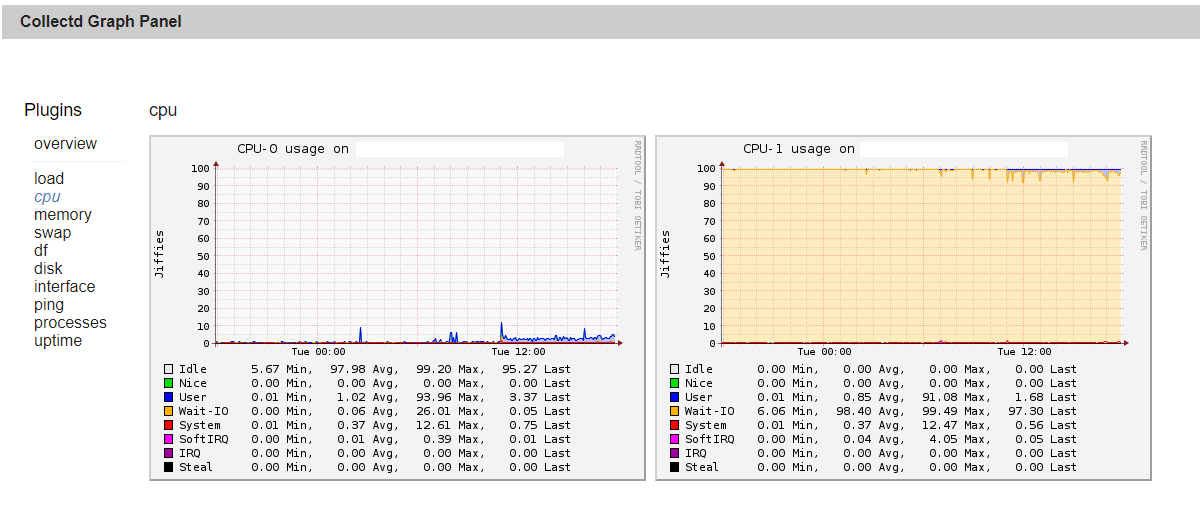
Can the process linked to the backup module generate a high Wait-IO on the second CPU?

That’s good, the lock is working :smiley:

I think you’ve find the smoking gun :wink: