I’m formally requesting a feature I’ve wanted for some time.
A line count in the log results panel.
What I do now is copy/paste relevant lines into excel for a count. Copy and paste is a pain because there’s a constant fight between the scroll management of results panel and the scroll management for the log search page, so if I scroll up and over scroll the whole page then scrolls up and the log panel falls of the bottom of the page so I have to start over scrolling and forcing the entire page back where I need it. Frustrating and time consuming. So copy and paste into excel or fight scrolling. meh. A line count on the left of the panel would be super cool, as in each line has it’s own number, 1, 2, 3, 4, etc. Alternatively, if that’s a huge thing, then I would like a simple total # of lines returned somewhere on the page down by the results panel.
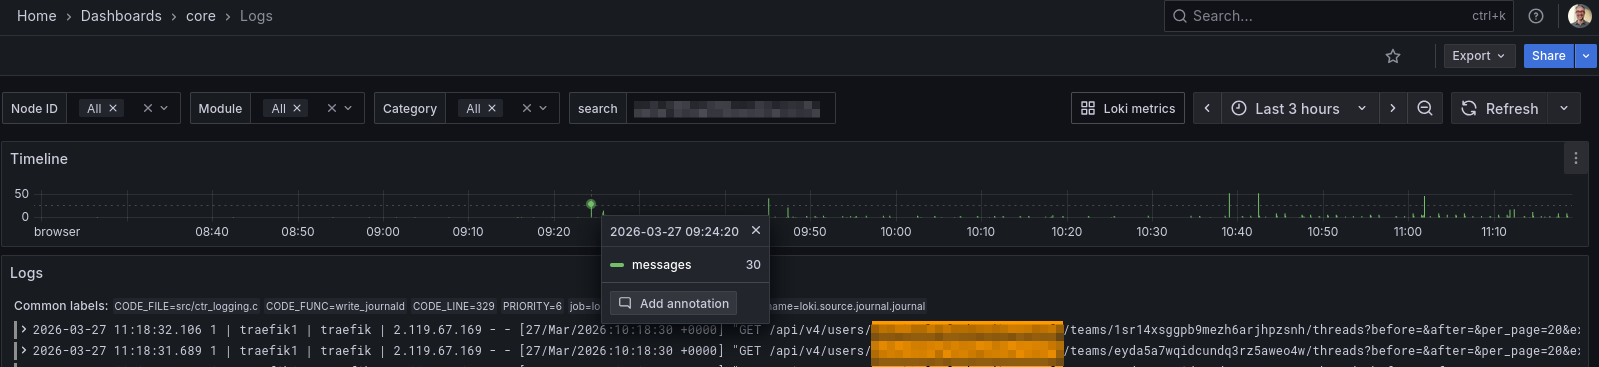
The Grafana Loki Logs interface provides a better experience, especially for time window selection. Its Timeline graph gives a clear view of how frequently a given string (e.g. an IP) appears in the logs.
I understand and agree. But it’s not what I’d call out of the box. I’ve enabled Grafana long ago and I use it if I’m deep diving into something but let’s face it, grafana requires it’s own level of knowledge to use effectively and for most of what I need it’s much faster and easier for me to do as I describe above than get into grafana. Between a line count, or total return count and ctrl F, that’s all I would want 96% of the time.
I see your point, and I agree the current UX makes this harder than it should be.
Unfortunately, with Grafana Loki there isn’t a native concept of “total returned lines” tied to a query (it’s not paginated like a database), so even the Grafana UI doesn’t expose that out of the box.
That said, for the “how many lines in this timeframe” use case, there is a simple Loki-side approach:
sum(count_over_time({your_query} [time_range]))
This gives you a total count without scrolling or exporting. It’s not wired into the UI today, but it could definitely be surfaced more easily.
I think your request still makes sense from a UX perspective:
line numbering in the panel, or
a simple “~N lines matched” indicator
would cover that 96% case without requiring Grafana knowledge.
So +1 from me — even if it’s an approximation under the hood, it would be a big usability win.