Reports->Graphs blank page

NethServer release 7.6.1810 (final)
Not sure which module

I have successfully migrated from Zentyal 5 to Nethserver.

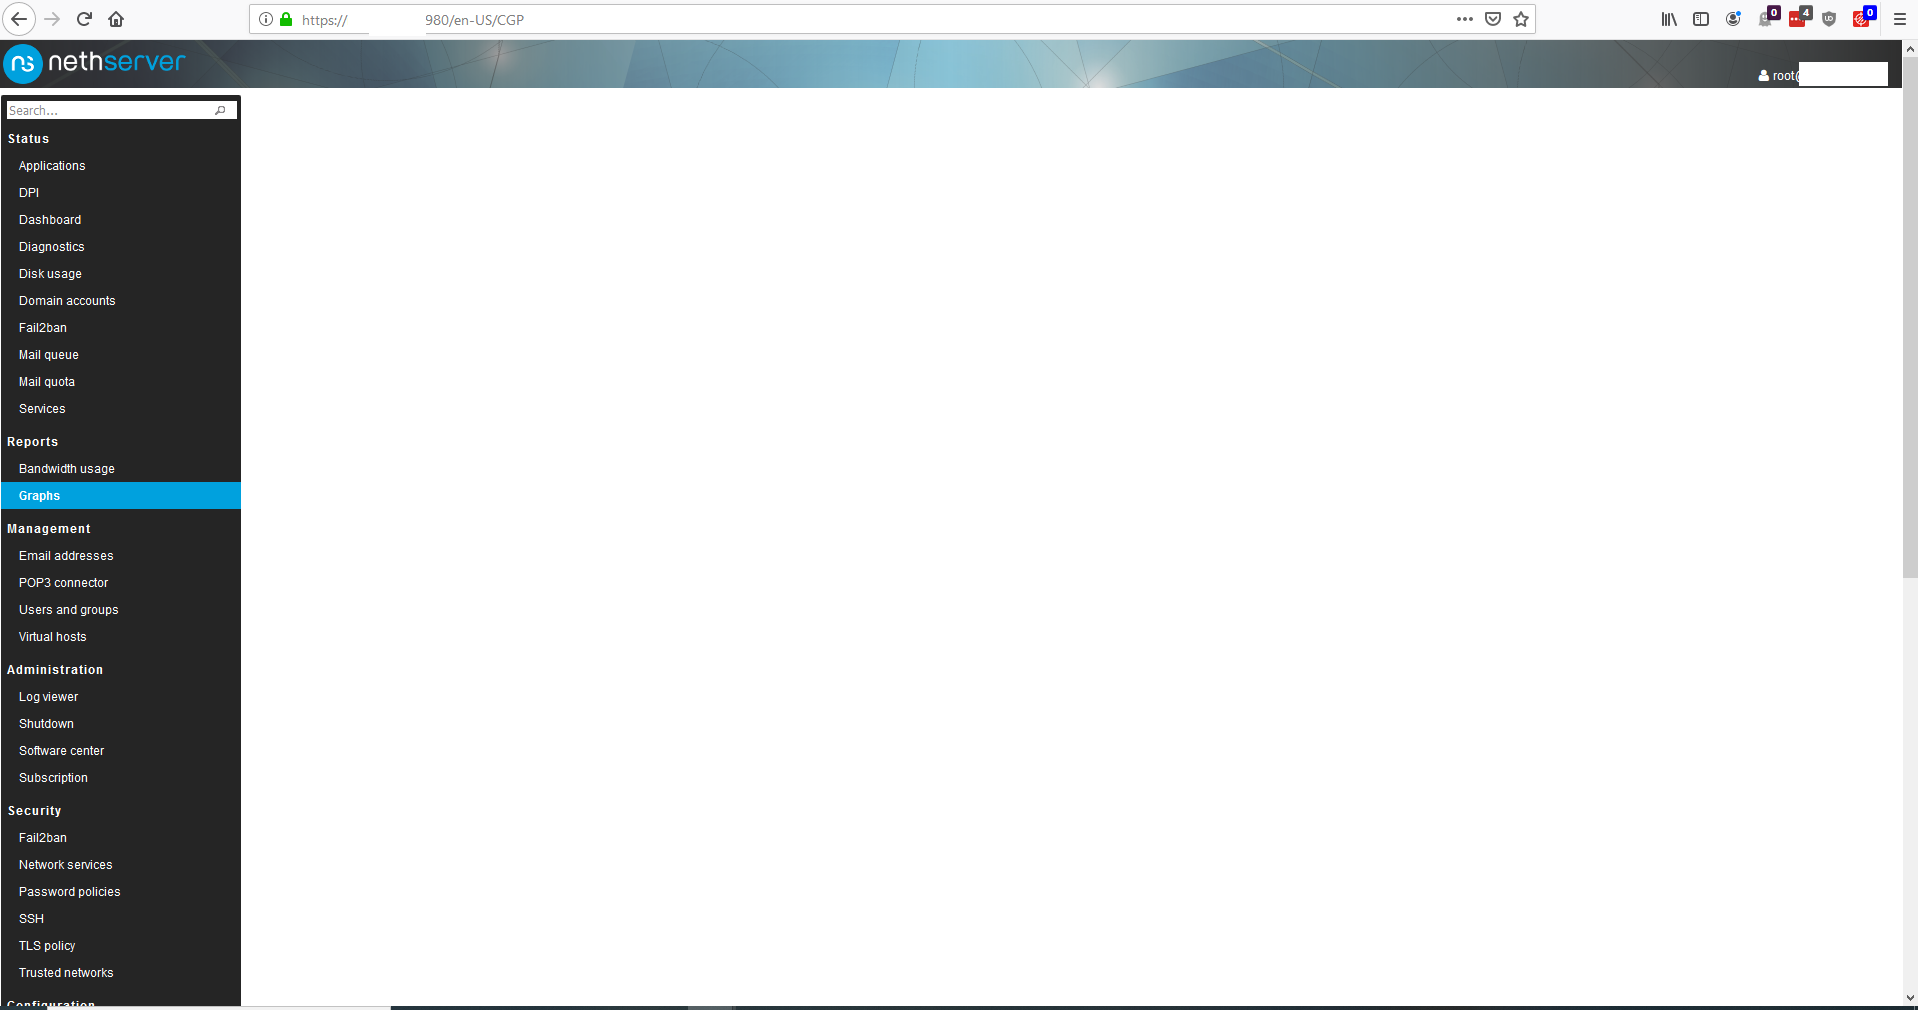
All is working fine except for the Reports->Graphs page.
This page remains blank, no errors are shown.

I have found no relevant information in the logs in /var/log.
The only entries shown are the successful GET in the httpd log.
./httpd-admin/access_log:4798:ip_removed - - [30/May/2019:11:36:09 +0200] “GET /en-US/CGP HTTP/1.1” 200 9159

How can I further investigate and fix the issue ?

Kind regards,

Klaas-Jan

You should also find a line in /var/log/httpd/access_log like:

127.0.0.1 - - [30/May/2019:11:48:05 +0200] "GET /7267d5d3bad56f2a0340daca32ffae507260/host.php?h=nethservice.nethesis.it HTTP/1.1" 200 6187 "https://nethservice.nethesis.it:980/it-IT/CGP" "Mozilla/5.0 (X11; Fedora; Linux x86_64) AppleWebKit/537.36 (KHTML, like Gecko) Chrome/74.0.3729.169 Safari/537.36"

You need httpd to serve graphs, httpd-admin passes the request to apache.

Hi Filippo,

That line is also there :

./httpd/access_log:2630:127.0.0.1 - - [30/May/2019:12:04:59 +0200] “GET /a9fd877a753414514faf4efbd065cb356b20ee0f/host.php?h=mail.baldy.nl HTTP/1.1” 200 4969 “https://mail.baldy.nl:980/en-US/CGP” “Mozilla/5.0 (Windows NT 6.3; Win64; x64; rv:67.0) Gecko/20100101 Firefox/67.0”

When trying a different broswer, in this case Chrome, I see a connection refused instead of the blank screen in Firefox.

But your log has a 200 http return code, which means success (after a connection).
I suspect a problem in your client pc, but it’s hard to tell.

Try this command from the shell:

curl -s http://localhost/a9fd877a753414514faf4efbd065cb356b20ee0f/ | grep CGP

It should display:

	<title>CGP</title>

When using the curl command I do get a response.

Am I correct in understanding the request is proxied to port 80 by the system ?

I doubt it is an issue with the client PC.as the issue is present on 2 different machines and on my galaxy s8.

The collectd service is up and running.

Removing and reinstalling the nethserver-statistics does not solve the issue.

When inspecting the frame the HTML is correct so the page is serverd, just nothing shown.

We never diagnosed a similar problem.
Could you share the saved html page?
Are collectd files there? /var/lib/collectd/rrd/$HOSTNAME

The Graph frame

<!DOCTYPE html> <html> <head> <meta charset=“utf-8”> <title>CGP - Mail.baldy.nl</title> <meta name=“viewport” content=“width=device-width”> <link rel=“stylesheet” href="/a9fd877a753414514faf4efbd065cb356b20ee0f/layout/style.css" type=“text/css”> <link rel=“stylesheet” href="/a9fd877a753414514faf4efbd065cb356b20ee0f/layout/style-b.css" type=“text/css” media="(max-width: 1000px),(max-device-width: 1000px) and (orientation: portrait),(max-device-width: 767px) and (orientation: landscape)"> <link rel=“stylesheet” href="/a9fd877a753414514faf4efbd065cb356b20ee0f/layout/style-c.css" type=“text/css” media="(max-width: 767px),(max-device-width: 767px) and (orientation: portrait),(max-device-width: 499px) and (orientation: landscape)"> <link rel=“stylesheet” href="/a9fd877a753414514faf4efbd065cb356b20ee0f/layout/style-d.css" type=“text/css” media="(max-width: 499px),(max-device-width: 499px) and (orientation: portrait)"> <meta http-equiv=“refresh” content=“60”> </head> <body> <div id=“header”> <h1><a href="/a9fd877a753414514faf4efbd065cb356b20ee0f/">Collectd Graph Panel</a></h1> </div> <div id=“content”> <fieldset id=“mail.baldy.nl”><legend>mail.baldy.nl</legend><input type=“checkbox” id=“navicon” class=“navicon” /> <label for=“navicon”></label> <div class=“plugins”><h2>Plugins</h2><ul><li><a class=“selected” href="/a9fd877a753414514faf4efbd065cb356b20ee0f/host.php?h=mail.baldy.nl">overview</a></li> <li><a class=“selected” href="/a9fd877a753414514faf4efbd065cb356b20ee0f/host.php?h=mail.baldy.nl&amp;p=load">load</a></li> <li><a class=“selected” href="/a9fd877a753414514faf4efbd065cb356b20ee0f/host.php?h=mail.baldy.nl&amp;p=cpu">cpu</a></li> <li><a class=“selected” href="/a9fd877a753414514faf4efbd065cb356b20ee0f/host.php?h=mail.baldy.nl&amp;p=memory">memory</a></li> <li><a class=“selected” href="/a9fd877a753414514faf4efbd065cb356b20ee0f/host.php?h=mail.baldy.nl&amp;p=swap">swap</a></li> <li><a href="/a9fd877a753414514faf4efbd065cb356b20ee0f/host.php?h=mail.baldy.nl&amp;p=df">df</a></li> <li><a href="/a9fd877a753414514faf4efbd065cb356b20ee0f/host.php?h=mail.baldy.nl&amp;p=disk">disk</a></li> <li><a href="/a9fd877a753414514faf4efbd065cb356b20ee0f/host.php?h=mail.baldy.nl&amp;p=interface">interface</a></li> <li><a href="/a9fd877a753414514faf4efbd065cb356b20ee0f/host.php?h=mail.baldy.nl&amp;p=ping">ping</a></li> <li><a href="/a9fd877a753414514faf4efbd065cb356b20ee0f/host.php?h=mail.baldy.nl&amp;p=processes">processes</a></li> <li><a href="/a9fd877a753414514faf4efbd065cb356b20ee0f/host.php?h=mail.baldy.nl&amp;p=uptime">uptime</a></li> </ul></div><div class=“graphs”><h2><a href="/a9fd877a753414514faf4efbd065cb356b20ee0f/host.php?h=mail.baldy.nl&amp;p=load">load</a></h2> <a href="/a9fd877a753414514faf4efbd065cb356b20ee0f/detail.php?p=load&amp;t=load&amp;h=mail.baldy.nl&amp;s=86400"><img src="/a9fd877a753414514faf4efbd065cb356b20ee0f/graph.php?p=load&amp;t=load&amp;h=mail.baldy.nl&amp;s=86400"></a> <h2><a href="/a9fd877a753414514faf4efbd065cb356b20ee0f/host.php?h=mail.baldy.nl&amp;p=cpu">cpu</a></h2> <a href="/a9fd877a753414514faf4efbd065cb356b20ee0f/detail.php?p=cpu&amp;pi=0&amp;t=cpu&amp;h=mail.baldy.nl&amp;s=86400"><img src="/a9fd877a753414514faf4efbd065cb356b20ee0f/graph.php?p=cpu&amp;pi=0&amp;t=cpu&amp;h=mail.baldy.nl&amp;s=86400"></a> <a href="/a9fd877a753414514faf4efbd065cb356b20ee0f/detail.php?p=cpu&amp;pi=1&amp;t=cpu&amp;h=mail.baldy.nl&amp;s=86400"><img src="/a9fd877a753414514faf4efbd065cb356b20ee0f/graph.php?p=cpu&amp;pi=1&amp;t=cpu&amp;h=mail.baldy.nl&amp;s=86400"></a> <h2><a href="/a9fd877a753414514faf4efbd065cb356b20ee0f/host.php?h=mail.baldy.nl&amp;p=memory">memory</a></h2> <a href="/a9fd877a753414514faf4efbd065cb356b20ee0f/detail.php?p=memory&amp;t=memory&amp;h=mail.baldy.nl&amp;s=86400"><img src="/a9fd877a753414514faf4efbd065cb356b20ee0f/graph.php?p=memory&amp;t=memory&amp;h=mail.baldy.nl&amp;s=86400"></a> <a href="/a9fd877a753414514faf4efbd065cb356b20ee0f/detail.php?p=memory&amp;t=percent&amp;h=mail.baldy.nl&amp;s=86400"><img src="/a9fd877a753414514faf4efbd065cb356b20ee0f/graph.php?p=memory&amp;t=percent&amp;h=mail.baldy.nl&amp;s=86400"></a> <h2><a href="/a9fd877a753414514faf4efbd065cb356b20ee0f/host.php?h=mail.baldy.nl&amp;p=swap">swap</a></h2> <a href="/a9fd877a753414514faf4efbd065cb356b20ee0f/detail.php?p=swap&amp;t=percent&amp;h=mail.baldy.nl&amp;s=86400"><img src="/a9fd877a753414514faf4efbd065cb356b20ee0f/graph.php?p=swap&amp;t=percent&amp;h=mail.baldy.nl&amp;s=86400"></a> <a href="/a9fd877a753414514faf4efbd065cb356b20ee0f/detail.php?p=swap&amp;t=swap&amp;h=mail.baldy.nl&amp;s=86400"><img src="/a9fd877a753414514faf4efbd065cb356b20ee0f/graph.php?p=swap&amp;t=swap&amp;h=mail.baldy.nl&amp;s=86400"></a> <a href="/a9fd877a753414514faf4efbd065cb356b20ee0f/detail.php?p=swap&amp;t=swap_io&amp;h=mail.baldy.nl&amp;s=86400"><img src="/a9fd877a753414514faf4efbd065cb356b20ee0f/graph.php?p=swap&amp;t=swap_io&amp;h=mail.baldy.nl&amp;s=86400"></a> </div></fieldset></body> </html>

Files are also present

drwxr-xr-x. 2 root root 177 Apr 29 18:00 cpu-0
drwxr-xr-x. 2 root root 177 Apr 29 18:00 cpu-1
drwxr-xr-x. 2 root root 91 Apr 29 18:00 df-boot
drwxr-xr-x. 2 root root 91 Apr 29 18:00 df-root
drwxr-xr-x 2 root root 91 Jun 1 11:24 df-run-user-991
drwxr-xr-x. 2 root root 83 Apr 29 18:28 disk-sda
drwxr-xr-x 2 root root 53 May 16 14:52 disk-sr0
drwxr-xr-x. 2 root root 49 Apr 29 18:00 interface-ens192
drwxr-xr-x. 2 root root 22 Apr 29 18:00 load
drwxr-xr-x. 2 root root 4096 Apr 29 18:00 memory
drwxr-xr-x. 2 root root 94 May 27 04:31 ping
drwxr-xr-x. 2 root root 27 Apr 29 18:00 processes
drwxr-xr-x. 2 root root 190 Apr 29 18:00 swap
drwxr-xr-x. 2 root root 24 Apr 29 18:00 uptime

When checking contents of the folders I see that the files are updated.
-rw-r–r--. 1 root root 148648 Jun 4 20:08 cpu-idle.rrd
-rw-r–r--. 1 root root 148648 Jun 4 20:07 cpu-interrupt.rrd
-rw-r–r--. 1 root root 148648 Jun 4 20:08 cpu-nice.rrd
-rw-r–r--. 1 root root 148648 Jun 4 20:08 cpu-softirq.rrd
-rw-r–r--. 1 root root 148648 Jun 4 20:08 cpu-steal.rrd
-rw-r–r--. 1 root root 148648 Jun 4 20:07 cpu-system.rrd
-rw-r–r--. 1 root root 148648 Jun 4 20:06 cpu-user.rrd
-rw-r–r--. 1 root root 148648 Jun 4 20:07 cpu-wait.rrd

I can see the page. Could you take a screenshot of what you see?

As last resort, try to restart the service:

systemctl restart httpd-admin

Sorry for the delayed response, it has been way too busy on this side.

Attached is the screenshot from the graphs page in Firefox.

Extensions such as Ghostery/uBlock are disabled on this page.

Restarting the hhtpd-admin service has already been tried.

Dumbest hint ever: whould you please try to start your browser (Firefox) with another profile?
Or use as test another browser?

Not a dumb question, browsers have been known to cause issues.

I have found and solved the issue.

It was due to creating a more secure ssl.conf file which included the following line :

Header always set X-Frame-Options DENY

This effectively blocks browsers to show the frame containing the graphs.

After commenting out this line and restarting services I do now have a working graphs page again.

Thanks for the help :smile:

1 Like