mark_nl
October 9, 2016, 1:46pm
1
Hi,
The memory plugin is, probably for good reasons, removed from collectd (ref #3414 )
and
http://dev.nethserver.org/issues/3414
Stubborn and hardheaded as some people call me (i’d like to opt just to have a strong own opinion),
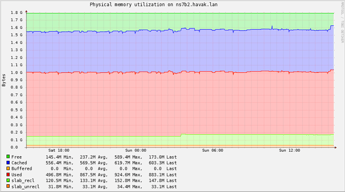
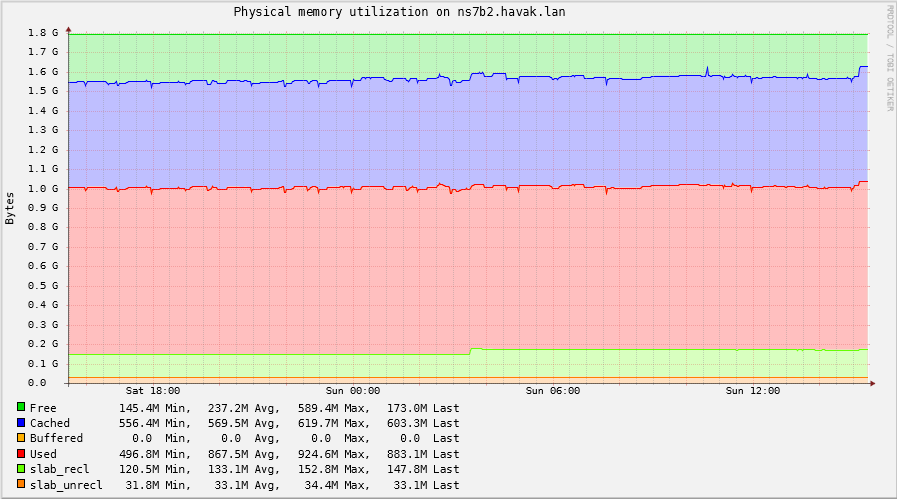
It running just fine for two day’s now:
What where reasons to remove it?
2 Likes
davidep
October 9, 2016, 8:13pm
2
I can’t check it now but… This looks very strange!
Are you sure the memory plugin is not already configured somewhere else?
/cc @dev_team
GG_jr
October 9, 2016, 8:25pm
3
The only plugins for collectd are in Reports → Graphs
But @giacomo already said why in issue 3414, i think.
2 Likes
davidep
October 9, 2016, 8:32pm
4
Maybe I’m wrong but threshold is not memory !
2 Likes
mark_nl
October 9, 2016, 8:37pm
6
Exactly my thoughts…
GG_jr:
Sorry!My FAULT!
As you sad before: its team work
2 Likes
GG_jr
October 9, 2016, 8:49pm
7
There is a reference about memory module.
davidep
October 9, 2016, 9:19pm
8
I don’t think you’re wrong at all @GG_jr ! I don’t get why @giacomo removed those lines for memory plugin too. I’m sure he can help us tomorrow!
1 Like
GG_jr
October 10, 2016, 6:13am
9
I checked now, also on NS 6.8 final (in production) and the memory plugin isn’t there.
giacomo
October 10, 2016, 6:55am
10
The memory plugins has been removed during the migration process, mainly because it was useless
The memory is always full on a linux machine and the graph doesn’t show really useful information.
If anybody agree we should add it back, I will open a new issue
2 Likes
mark_nl
October 10, 2016, 8:00am
11
Let agree to disagree.
Exually because linux always reports the memory to be full it’s shows useful information:
green on the bottom : memory allocated to the kernel (cutting some corners here
In general i really start to worry if the red line (=kernel + apps) uses more then 50% in a idle state;
EDIT 3 :
3 Likes
giacomo
October 12, 2016, 12:47pm
12
5 Likes
alefattorini
October 13, 2016, 1:33pm
13
Wow, you’re super fast friend! @mark_nl @GG_jr can you ask more?
GG_jr
October 13, 2016, 6:02pm
14
Indeed!
alefattorini:
@GG_jr can you ask more?
Anytime my friend! Anytime!
2 Likes


 )
)
