Hi all,
we are proud to announce our brand new project named Dante inspired by Dante Alighieri and his famous Divina Commedia.
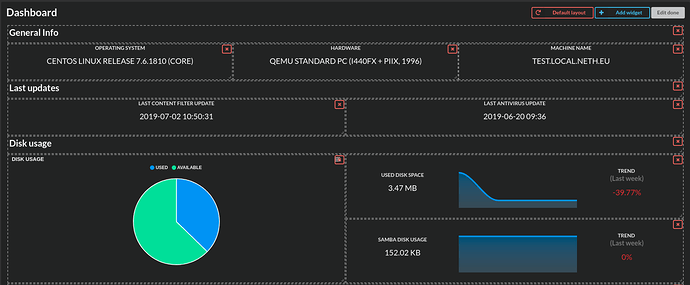
This project provides a beautiful recap of your system by collecting data from logs, databases, services, files and showing the results in a fully customizable dashboard running directly on your system.
You can also customize the interval date to show the statistics and send it via mail to different addresses.
Structure
The project is composed by four parts:
- Beatrice: it’s a single page application written in VueJs that shows the statistics in a beautiful dashboard, fully customizable by drag and dropping widgets
- Caronte: it’s a nodeJS application that screenshots the dashboard and its statistics and sent it via mail to the chosen addresses with a PDF as attachment
- Ciacco: it’s the wrapper of all miners (the scripts that collects statistics from data in the system) that is executed every day
- Virgilio: it’s the server written in Go that send statistics from server to the dashboard, doing the dirty job by counting and aggregating data in defined date interval
Like others NethServer module, Dante has its own configuration package inside the Cockpit UI, the name is nethserver-dante.
Preview
The UI it’s very simple and intuitive, there are 2 main components:
Navbar
Where you can choose:
-
Date interval:
Last week,Last month,Last 6 months - Colors: you can choose 9 different color palettes to change charts colors
- Full search: you can search the widget in the dashboard by typing text in the search input
-
Theme: there are 2 different themes for the UI:
LightandDark
Dashboard
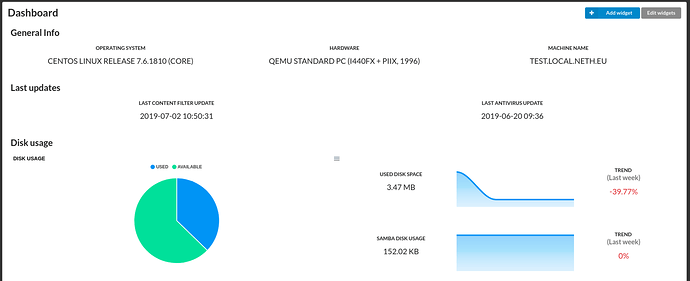
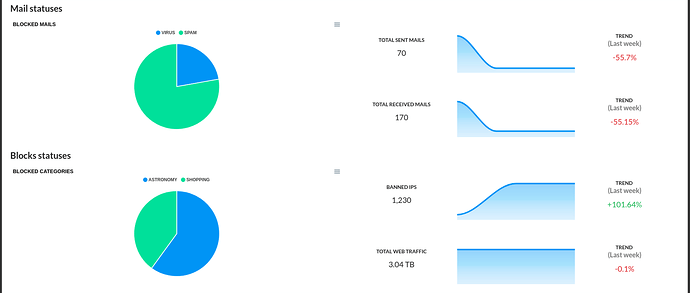
White theme
Example 1
Example 2
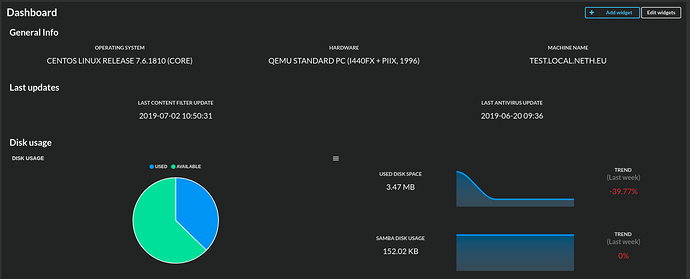
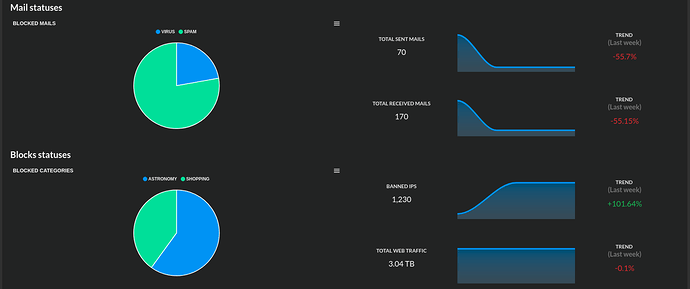
Dark theme
Example 1
Example 2
Edit mode
You can customize the layout of the dashboard clicking on the Edit widgets button in the right top corner
Add/Remove widget
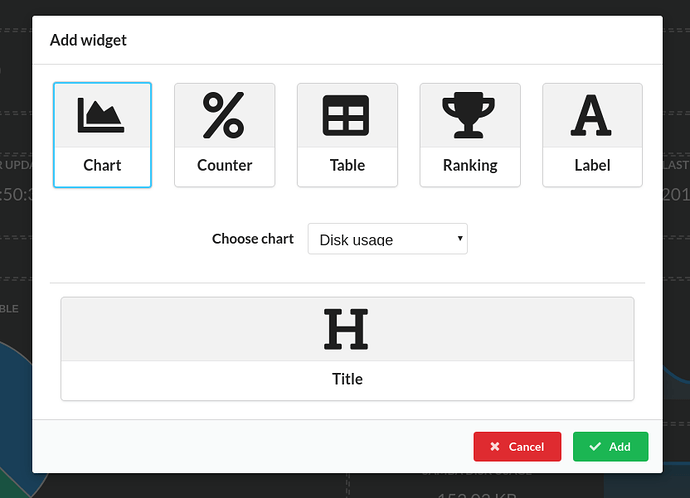
You can also add and remove the widgets in the dashboard creating a personal layout
Widgets
There are 6 different types of widgets:
- Chart: pie, bar, lines charts with data visualized
- Counter: contains last values aggregated, the values in the interval date and the final trend
- Table: a simple table to show list of values
- Ranking: the top N items of a particularly list
- Label: simple label tho show only text
- Title: customizable text widget to better organize dashboard layout
Mail Preview
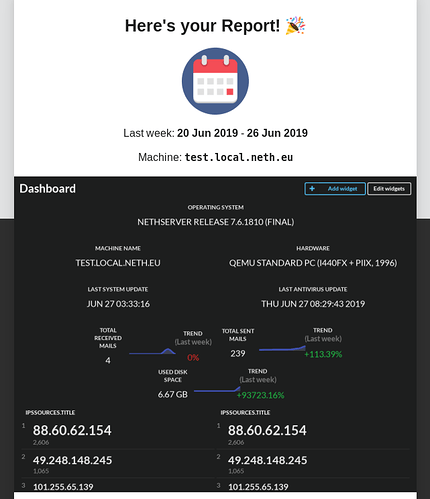
You can decide mail recipient and when the email will sent, the email looks like this:
The attached PDF is a completely full export of the dashboard.
NethServer module preview
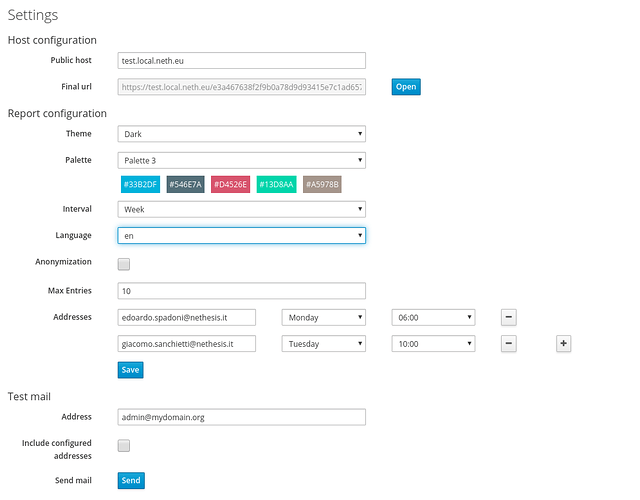
In the settings page of nethserver-dante module, you can configure each of the above described feature in the classical way.
Install
You can easily install dante and nethserver-dante with this command:
yum install --enablerepo=nethserver-testing nethserver-dante
References
Authors
Andrea Leardini @andre8244
Edoardo Spadoni @edoardo_spadoni
Giacomo Sanchietti @giacomo


 thanks for teaching also this