This really doesn’t have anything to do with Nethserver, though I guess it might be possible to run it there, but I’ve been playing with Kotori, a handy preconfigured distribution of InfluxDB, Grafana, MQTT, and some other related software. It makes visualizing your data easy–just throw JSON at it (via MQTT or HTTP), and then build (or import from grafana.com) graphics to visualize it. Here’s a simple dashboard I built of my weather station:

Here’s one I built for my solar system:

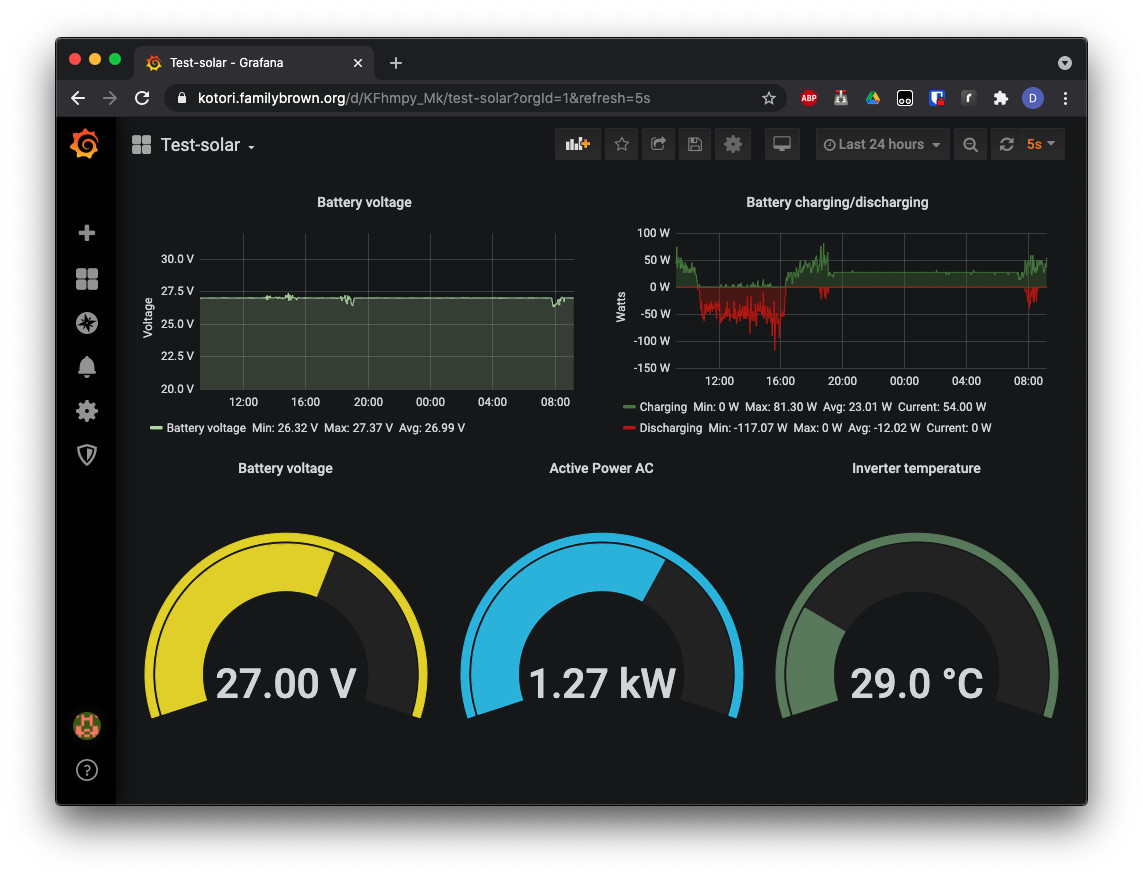
And here’s a more fancy one for my solar system–this one was imported from grafana.com and modified to suit my system:
I have it set up on a Ubuntu VM, running behind a Caddy (of course) reverse proxy, but I’d expect the Docker setup instructions would work on Neth if desired.
Edit: Why Caddy? Here’s the entire Caddy config file, handling TLS, including getting and renewing a cert from my local tiny CA, etc.:
{
	email me@mydomain
	acme_ca https://ca.familybrown.org/acme/acme/directory
	acme_ca_root /etc/caddy/root_ca.crt
}

kotori.familybrown.org {
	file_server
	reverse_proxy localhost:3000
}
That’s the only configuration required for the webserver/reverse proxy.