NethServer Version: 7.7
Module:
2 points here.
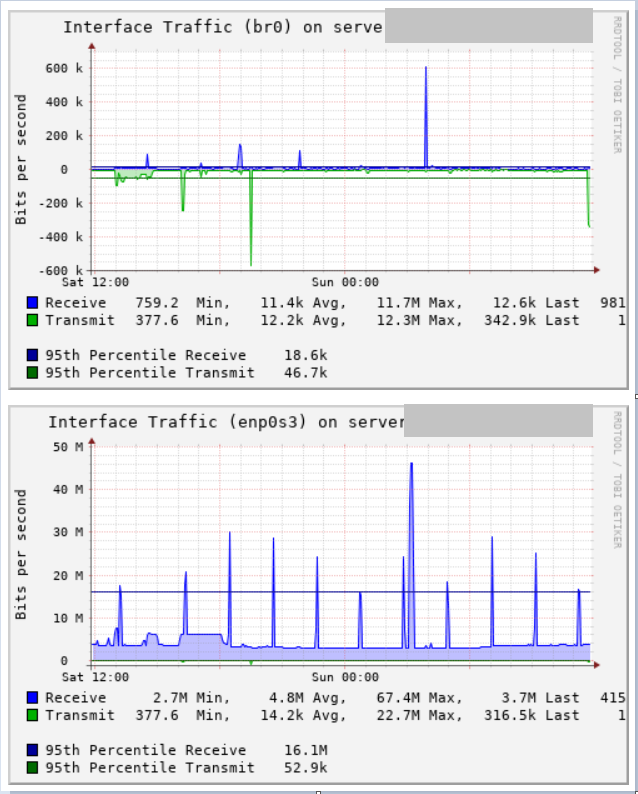
I updated this server to 7.7 a couple of days ago. I noticed in the cockpit dashboard that the realtime Network graph showed a constant traffic rate of about 4.5mbps. That traffic rate was inappropriate for the servers use and connections. I checked the gateway logs the server sits behind and this traffic wasn’t visible, I checked netstat and saw no connections responsible. wtf??? This server has collectd installed so I checked that. I discovered it was the container interface not the network interface. I also looked out for the year, the traffic level on that interface has been constant for the period of the year.
I checked another NS samba server I have running, its traffic is negligible, in the kbps for the period of that last year. Resource usage for that high traffic server is negligible, .02 load, low cpu usage, typical ram usage > 2GB.
So, I’m looking for ideas as to why the traffic is consistently running at 4.8mbps on that container on that server.
Why is the Cockpit realtime network graph pulling from that interface and not the network interface, that’s not really helpful I would think? – (edit) - I’ve now realized its drawing from all the interfaces.