jjmmbb
September 27, 2025, 12:25am
1
NethServer Version: 8Module: metrics from settings
I enabled the metrics option in the NethServer settings. However, when I try to access the Samba module Dashboard , I encounter errors related to the Grafana password. The logs show authentication failures, as seen below:
Código
grafana[21850]: logger=authn.service t=2025-09-27T00:16:38.978888262Z level=info msg="Failed to authenticate request" client=auth.client.basic error="[password-auth.failed] failed to authenticate identity: [password-auth.invalid] invalid password"

grafana[21850]: logger=authn.service t=2025-09-27T00:22:03.113924437Z level=info msg="Failed to authenticate request" client=auth.client.basic error="[password-auth.failed] too many consecutive incorrect login attempts for user - login for user temporarily blocked"
It seems that Grafana is rejecting the credentials, either due to an invalid password or because of too many failed login attempts, which temporarily blocks the user.
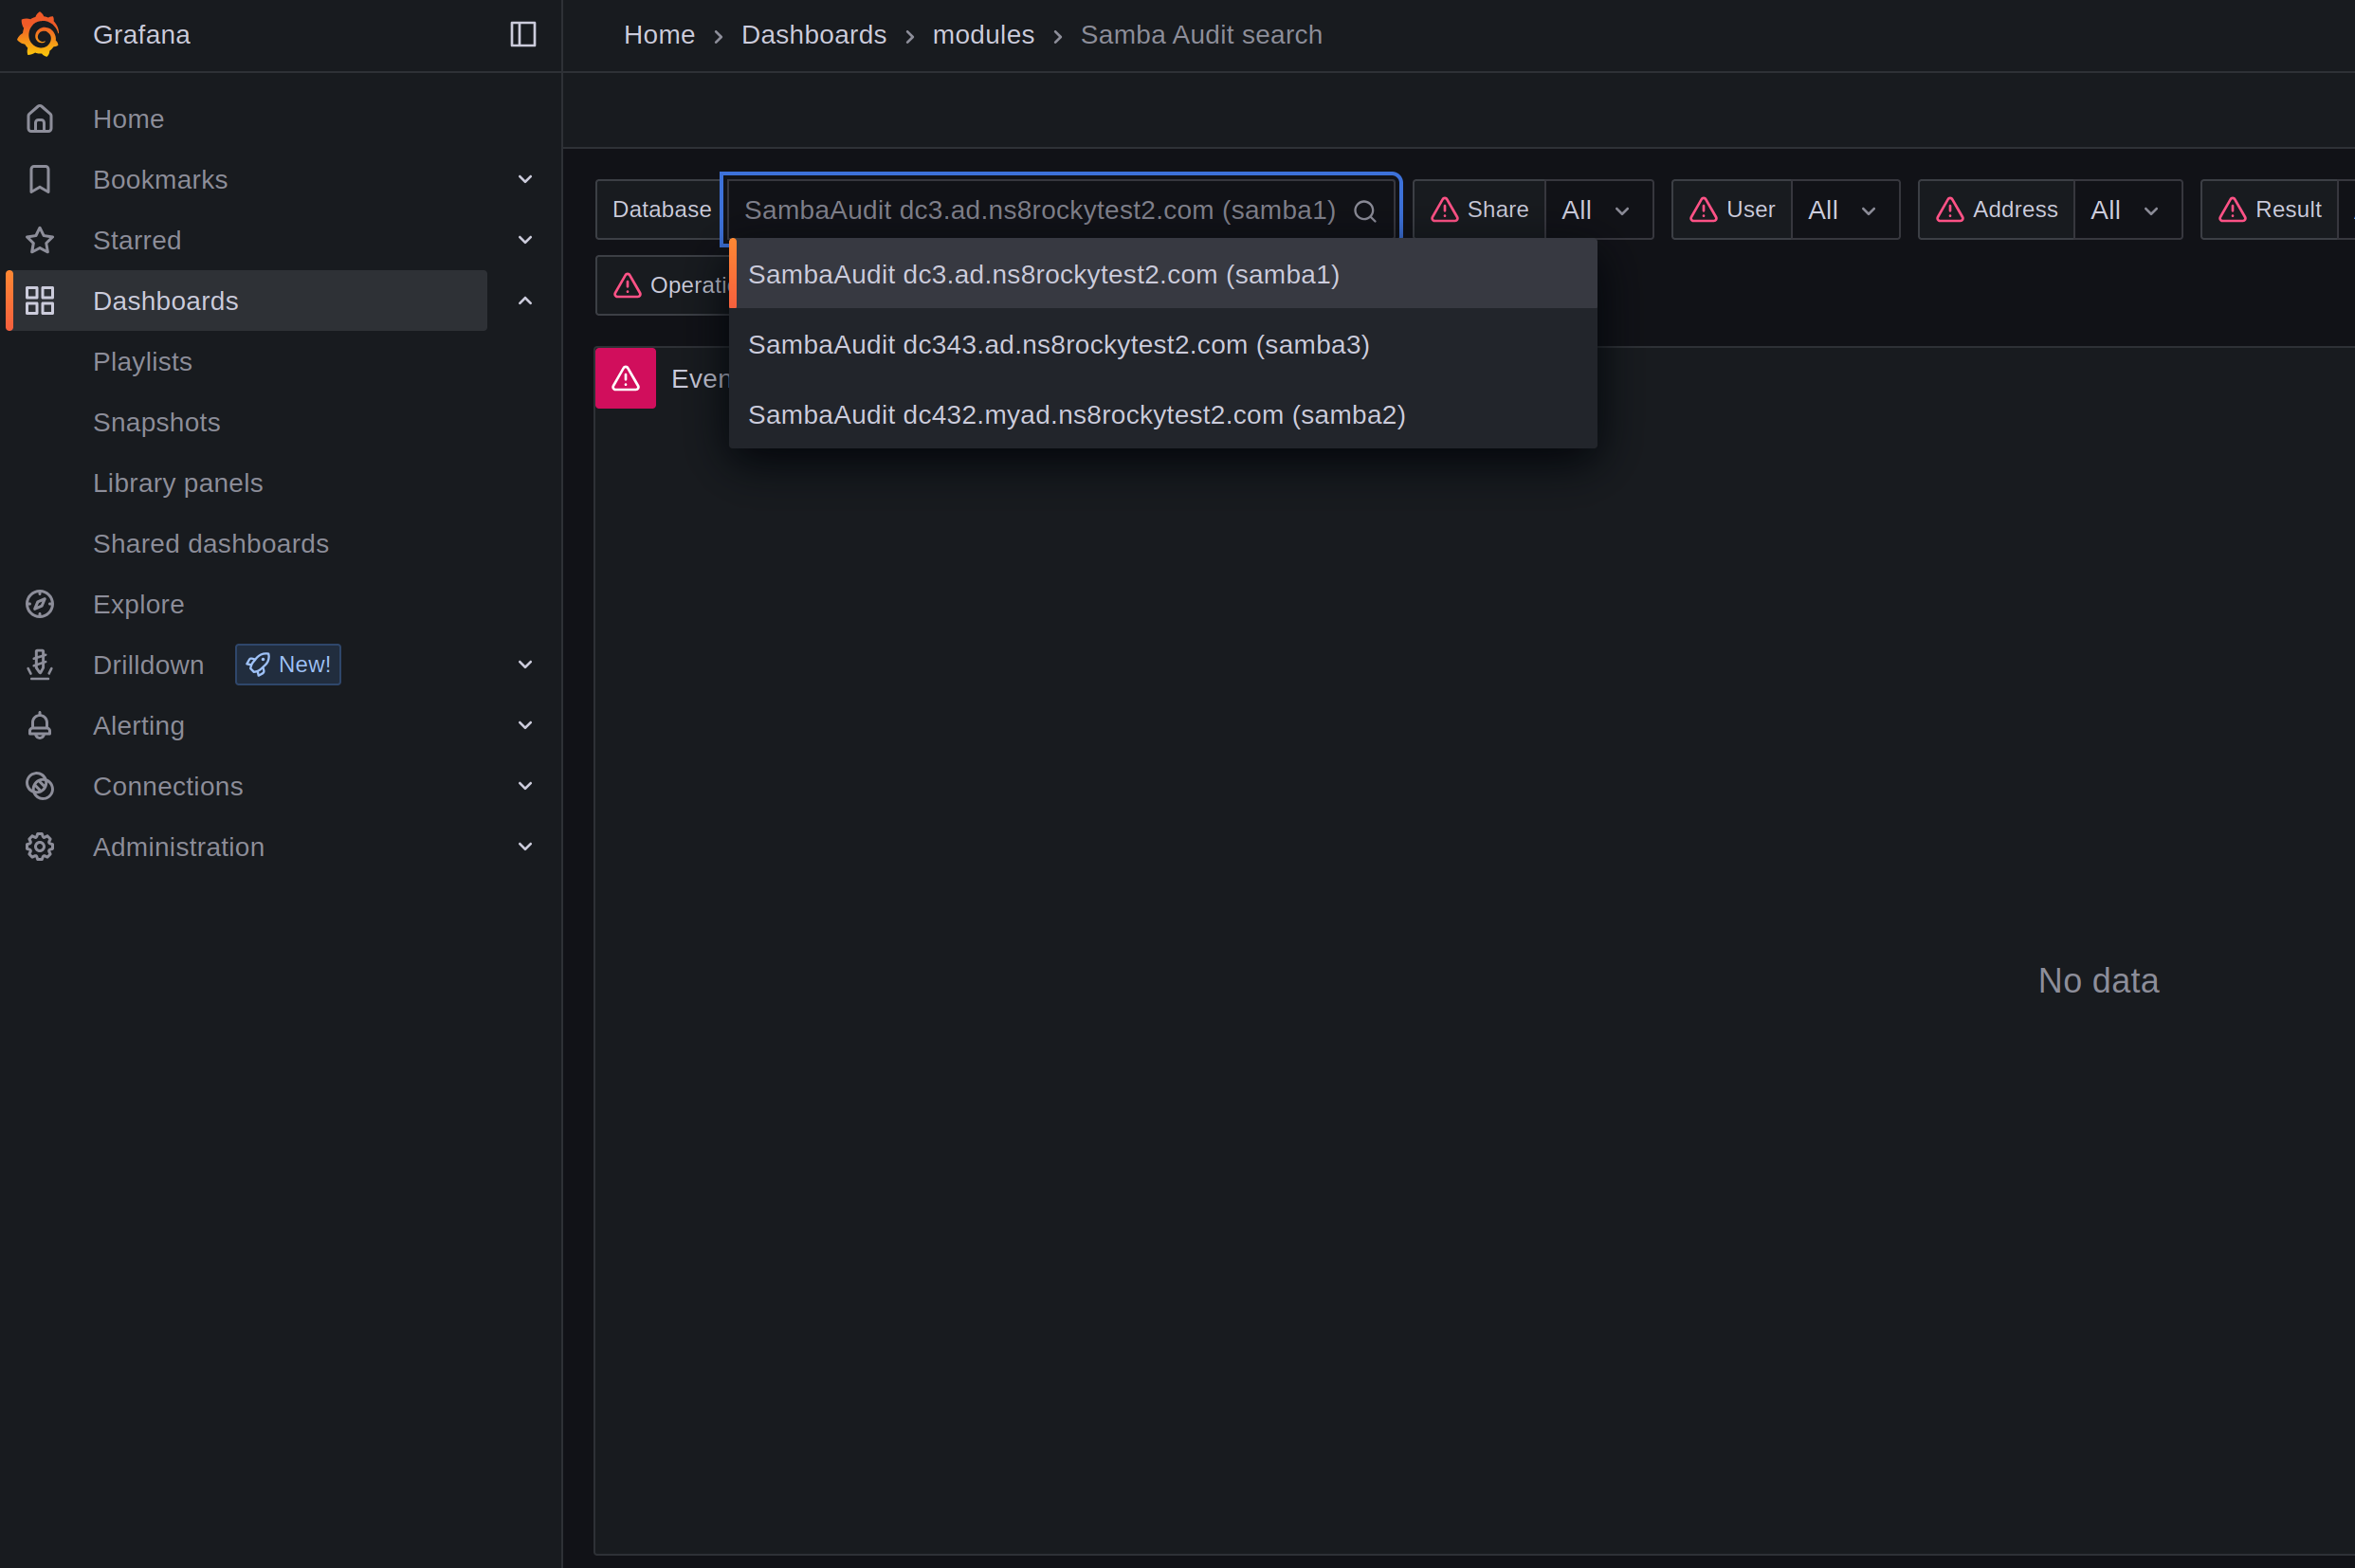
Core dashboards: Loki metrics, Node Exporter Full and Logs are working great. Just Dashboard from Samba Audit os not working.
I am also getting:
Sep 26 21:31:22 nethserver api-server[11058]: [AUDIT][STORE] error in audit file schema begin: database is locked
mrmarkuz
September 27, 2025, 5:00pm
2
I think I could reproduce the issue. Do you have removed samba instances?
2025-09-27T18:55:28+02:00 [1:metrics1:grafana] logger=authn.service t=2025-09-27T16:55:28.219266663Z level=info msg="Failed to authenticate request" client=auth.client.basic error="[password-auth.failed] too many consecutive incorrect login attempts for user - login for user temporarily blocked"
2025-09-27T18:55:28+02:00 [1:metrics1:grafana] logger=context userId=1 orgId=1 uname=admin t=2025-09-27T16:55:28.328025188Z level=info msg="Request Completed" method=POST path=/api/ds/query status=400 remote_addr=192.168.3.133 time_ms=8 duration=8.226716ms size=926 referer="https://192.168.3.141/graf/d/62c45ab2-bfd9-4971-8688-c9e65209ef5e/samba-audit-search?from=now-24h&orgId=1&timezone=browser&to=now&var-addr=%24__all&var-op=%24__all&var-path=%24__all&var-proto=%24__all&var-result=%24__all&var-samba_audit_database=P2C453B7700DF8EB0&var-share=%24__all&var-username=%24__all" handler=/api/ds/query status_source=downstream
2025-09-27T18:57:15+02:00 [1:metrics1:grafana] logger=authn.service t=2025-09-27T16:57:15.625603394Z level=info msg="Failed to authenticate request" client=auth.client.basic error="[password-auth.failed] failed to authenticate identity: [password-auth.invalid] invalid password"
Another thing to check as you got multiple issues today: Is the disk full?
df -h / /home
jjmmbb
September 28, 2025, 11:29pm
3
Not full. I have enough disk space. And I have only one record on Database using the correct instance (Samba1).
mrmarkuz
September 29, 2025, 7:21am
4
Maybe it helps to reset the timescaledb in samba by removing the volume? Audit data will be lost.
runagent -m samba1
systemctl --user stop timescaledb
podman volume rm timescaledb
systemctl --user start timescaledb
Does it help to remove the grafana-data volume to rebuild the volume? The grafana data will be lost.
runagent -m metrics1
systemctl --user stop grafana
podman volume rm grafana-data
systemctl --user start grafana
jjmmbb
September 29, 2025, 11:35pm
5
Tried both. Still getting password error message.
mrmarkuz
September 30, 2025, 7:34am
6
Maybe it helps to remove the database and restart the api server so it’s recreated. Audit data will be lost.
Move away the database:
mv /var/lib/nethserver/api-server/audit.db ~
Restart api-server:
systemctl restart api-server
See also API server | NS8 dev manual
EddieA
October 10, 2025, 7:50pm
7
I’m seeing the same error. Tried all the suggestions in this thread and here’s the last few lines from the restart of the api-server:
2025-10-10T12:45:44-07:00 [1:metrics1:grafana] logger=provisioning.alerting t=2025-10-10T19:45:44.39690741Z level=info msg="starting to provision alerting"
2025-10-10T12:45:44-07:00 [1:metrics1:grafana] logger=provisioning.alerting t=2025-10-10T19:45:44.396932985Z level=info msg="finished to provision alerting"
2025-10-10T12:45:44-07:00 [1:metrics1:grafana] logger=provisioning.dashboard t=2025-10-10T19:45:44.398561942Z level=info msg="starting to provision dashboards"
2025-10-10T12:45:45-07:00 [1:metrics1:grafana] logger=grafana-apiserver t=2025-10-10T19:45:45.620614425Z level=info msg="Adding GroupVersion userstorage.grafana.app v0alpha1 to ResourceManager"
2025-10-10T12:45:45-07:00 [1:metrics1:grafana] logger=grafana-apiserver t=2025-10-10T19:45:45.621434358Z level=info msg="Adding GroupVersion playlist.grafana.app v0alpha1 to ResourceManager"
2025-10-10T12:45:45-07:00 [1:metrics1:grafana] logger=grafana-apiserver t=2025-10-10T19:45:45.626994625Z level=info msg="Adding GroupVersion dashboard.grafana.app v1beta1 to ResourceManager"
2025-10-10T12:45:45-07:00 [1:metrics1:grafana] logger=grafana-apiserver t=2025-10-10T19:45:45.627855571Z level=info msg="Adding GroupVersion dashboard.grafana.app v0alpha1 to ResourceManager"
2025-10-10T12:45:45-07:00 [1:metrics1:grafana] logger=grafana-apiserver t=2025-10-10T19:45:45.628943369Z level=info msg="Adding GroupVersion dashboard.grafana.app v2alpha1 to ResourceManager"
2025-10-10T12:45:45-07:00 [1:metrics1:grafana] logger=grafana-apiserver t=2025-10-10T19:45:45.629473773Z level=info msg="Adding GroupVersion featuretoggle.grafana.app v0alpha1 to ResourceManager"
2025-10-10T12:45:45-07:00 [1:metrics1:grafana] logger=grafana-apiserver t=2025-10-10T19:45:45.630292358Z level=info msg="Adding GroupVersion folder.grafana.app v1beta1 to ResourceManager"
2025-10-10T12:45:45-07:00 [1:metrics1:grafana] logger=grafana-apiserver t=2025-10-10T19:45:45.631662955Z level=info msg="Adding GroupVersion iam.grafana.app v0alpha1 to ResourceManager"
2025-10-10T12:45:45-07:00 [1:metrics1:grafana] logger=grafana-apiserver t=2025-10-10T19:45:45.634555677Z level=info msg="Adding GroupVersion notifications.alerting.grafana.app v0alpha1 to ResourceManager"
2025-10-10T12:45:45-07:00 [1:metrics1:grafana] logger=app-registry t=2025-10-10T19:45:45.693181033Z level=info msg="app registry initialized"
2025-10-10T12:45:46-07:00 [1:metrics1:grafana] logger=provisioning.dashboard t=2025-10-10T19:45:46.095441507Z level=info msg="finished to provision dashboards"
2025-10-10T12:45:58-07:00 [1:metrics1:grafana] logger=authn.service t=2025-10-10T19:45:58.617715676Z level=info msg="Failed to authenticate request" client=auth.client.basic error="[password-auth.failed] failed to authenticate identity: [password-auth.invalid] invalid password"
2025-10-10T12:45:58-07:00 [1:metrics1:grafana] logger=context userId=1 orgId=1 uname=admin t=2025-10-10T19:45:58.660659703Z level=info msg="Request Completed" method=GET path=/api/live/ws status=-1 remote_addr=192.168.0.3 time_ms=75 duration=75.140727ms size=0 referer= handler=/api/live/ws status_source=server
2025-10-10T12:45:58-07:00 [1:metrics1:grafana] logger=live t=2025-10-10T19:45:58.665444161Z level=info msg="Initialized channel handler" channel=grafana/dashboard/uid/celxufp5yoq2oe address=grafana/dashboard/uid/celxufp5yoq2oe
2025-10-10T12:45:58-07:00 [1:metrics1:grafana] logger=authn.service t=2025-10-10T19:45:58.698174019Z level=info msg="Failed to authenticate request" client=auth.client.basic error="[password-auth.failed] failed to authenticate identity: [password-auth.invalid] invalid password"
Cheers.
EddieA
October 13, 2025, 1:11am
9
LayLow:
Maybe this helps
They don’t really appear to match the issue.
But regardless, as all I’m running is the Metrics and Grafana as embedded in NS8 with nothing external involved, any issues should be resolved within NS8.
Cheers.
mrmarkuz
October 15, 2025, 7:07am
10
@EddieA @jjmmbb which distro do you use? Debian, Rocky?
Did you install the prometheus app before? Maybe it conflicts somehow with the metrics app?
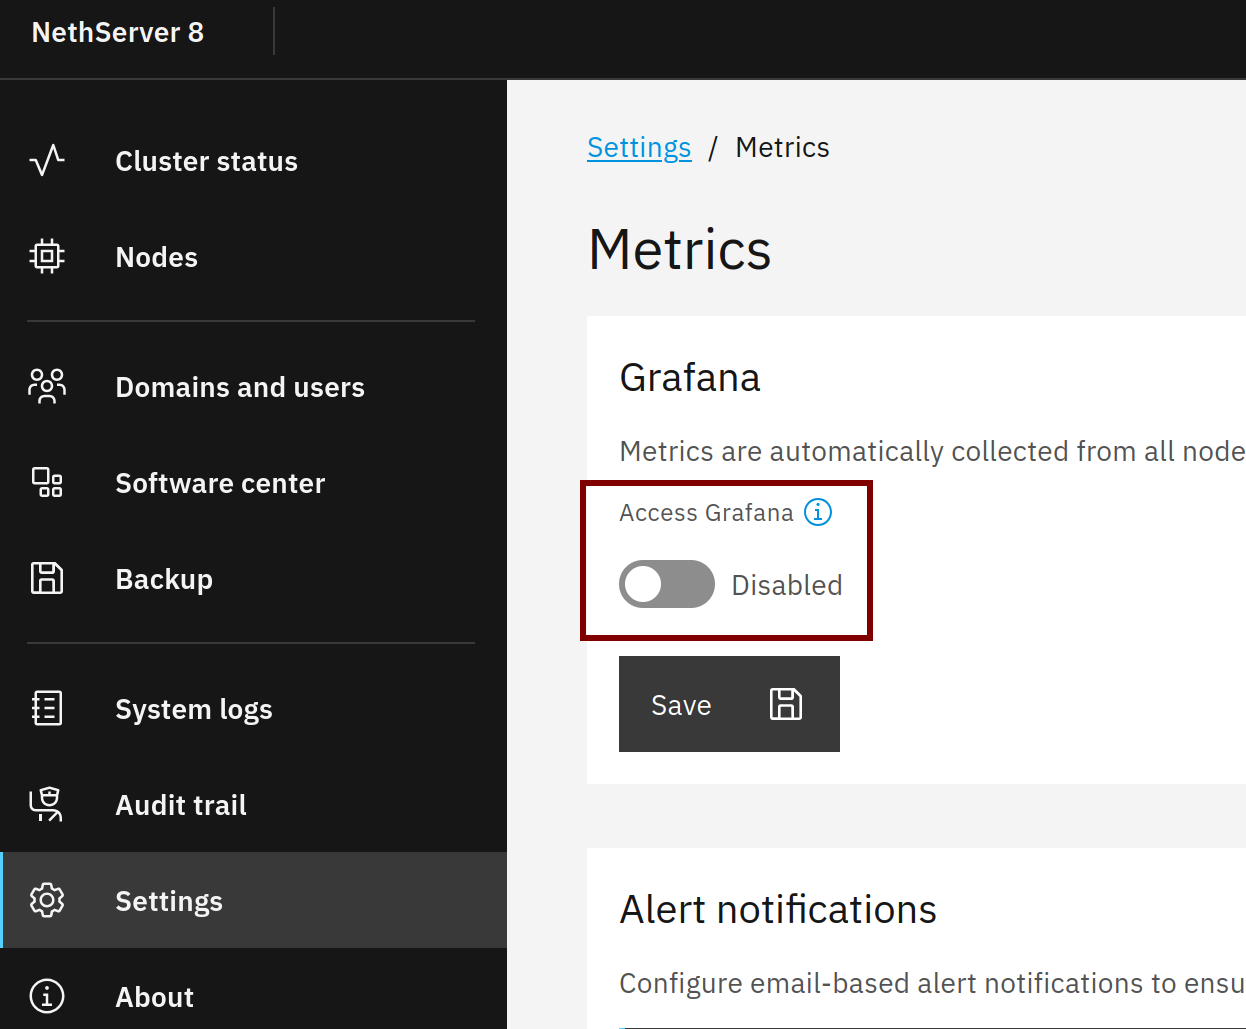
Did you already try to disable and enable Grafana again so the HTTP route gets recreated?
EddieA
October 15, 2025, 4:45pm
11
mrmarkuz:
which distro do you use?
Rocky.
Nope.
Only the commands above.
What commands did you want us to try.
mrmarkuz
October 15, 2025, 4:50pm
12
Just a blind shot, maybe disabling and reenabling Grafana in the metrics UI helps:
mrmarkuz
October 18, 2025, 8:27am
13
Maybe the used API passwords do not match so let’s compare the loki password with the used passwords in Grafana and Prometheus.
In this example the loki and metrics instance names are loki1 and metrics1
Check installed loki instance name:
[root@ns8rockytest ~]# ls /home | grep loki
loki1
Check loki1 API password in redis:
[root@ns8rockytest ~]# redis-cli hget module/loki1/environment LOKI_API_AUTH_PASSWORD
"0731b848-ce5c-48b9-8220-1ab7f6f8f6cb"
Check metrics instance name:
[root@ns8rockytest ~]# ls /home | grep metrics
metrics1
Check the password that metrics1 prometheus uses:
[root@ns8rockytest ~]# runagent -m metrics1 grep password prometheus.yml
      password: "0731b848-ce5c-48b9-8220-1ab7f6f8f6cb"
Same for metrics1 grafana:
[root@ns8rockytest ~]# runagent -m metrics1 grep Password datasources/local.yml
      basicAuthPassword: 0731b848-ce5c-48b9-8220-1ab7f6f8f6cb
EddieA
October 20, 2025, 9:45pm
14
root@ns8:~# ls /home | grep loki
loki1
root@ns8:~# redis-cli hget module/loki1/environment LOKI_API_AUTH_PASSWORD
"895050fc-5a41-4a29-8df5-ca75d3e623c7"
root@ns8:~# ls /home | grep metrics
metrics1
root@ns8:~# runagent -m metrics1 grep password prometheus.yml
      password: "895050fc-5a41-4a29-8df5-ca75d3e623c7"
root@ns8:~# runagent -m metrics1 grep Password datasources/local.yml
      basicAuthPassword: 895050fc-5a41-4a29-8df5-ca75d3e623c7
root@ns8:~#
Cheers.
1 Like
EddieA
October 20, 2025, 11:26pm
15
Not really sure when this changed, but now, I’m seeing the statistics in Grafana despite still seeing the failed authentication messages in the metrics app.
Cheers.
1 Like
jjmmbb
November 26, 2025, 1:04pm
16
All the same passwords here and the problem persists.
mrmarkuz
November 27, 2025, 9:59am
17
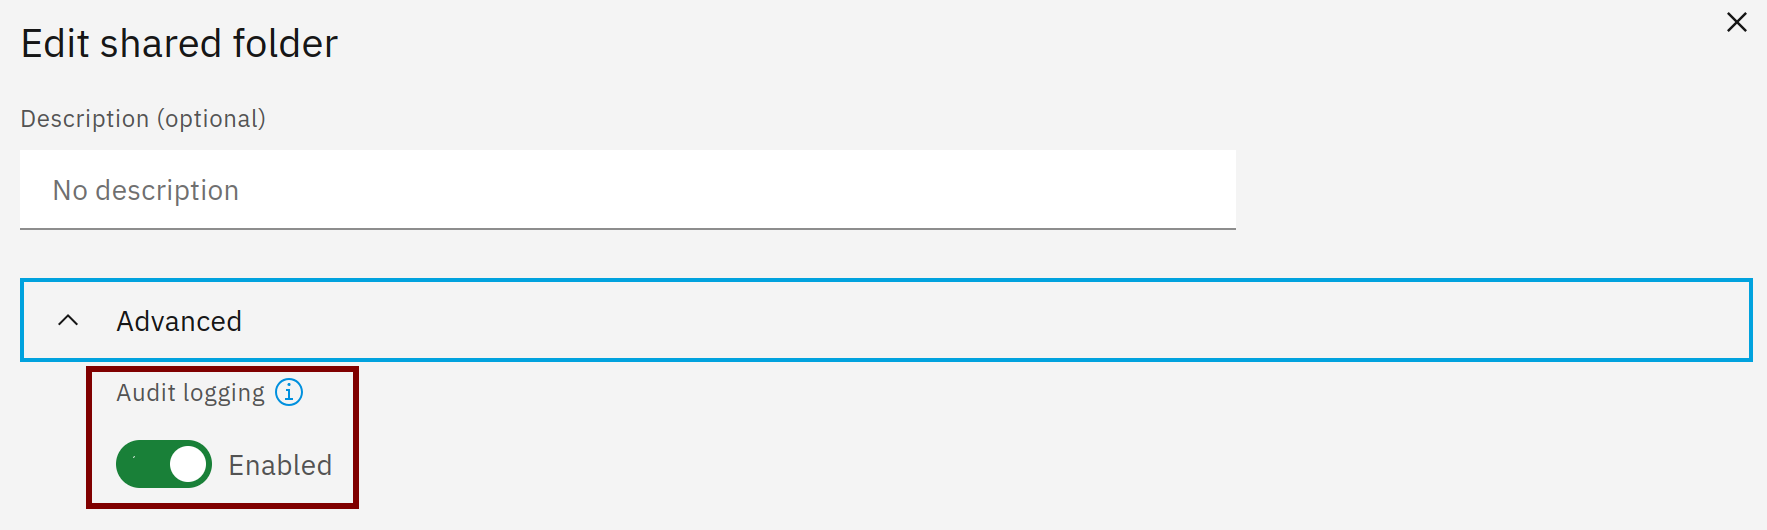
Just to be sure, did you enable auditing for the share?
Did you already try to remove metrics and reinstall it? Data may be lost.
remove-module --no-preserve metrics1
Check for the newest metrics release here .
add-module ghcr.io/nethserver/metrics:1.2.0