First of all, thank you for the amazing work on NethSecurity 8.7.1 — it’s solid, reliable, and I love it.
That said… the firewall logs right now are a bit like reading hieroglyphics after a triple espresso . They’re technically correct, but very hard to read in real time, and not exactly “quick-glance-friendly” for troubleshooting.
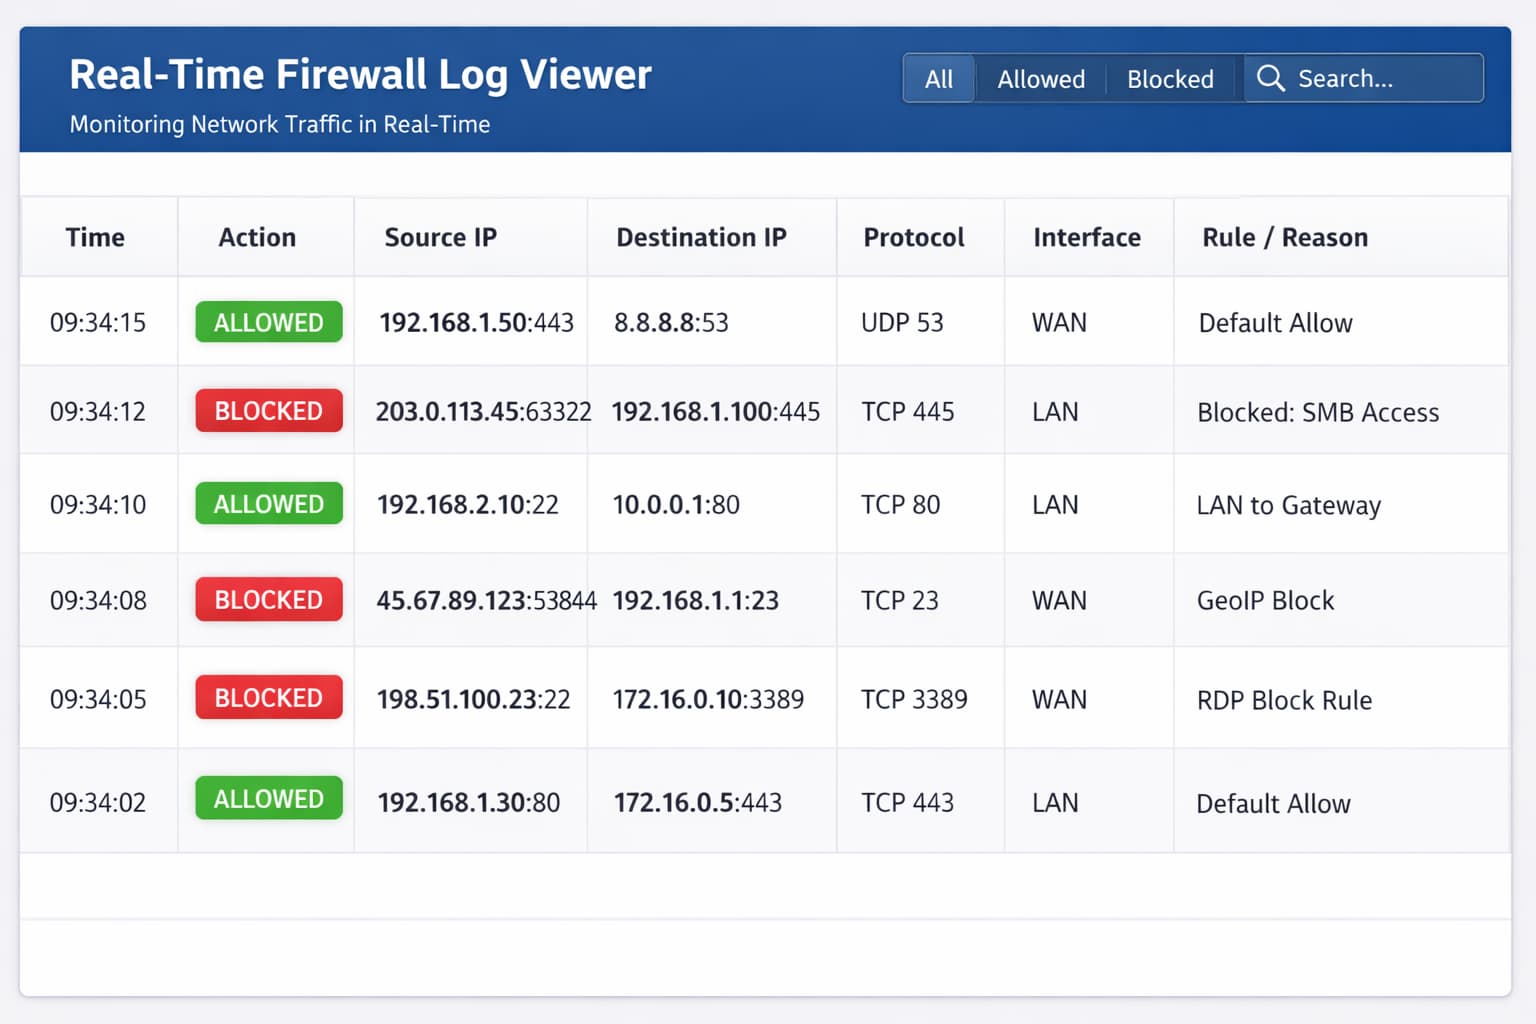
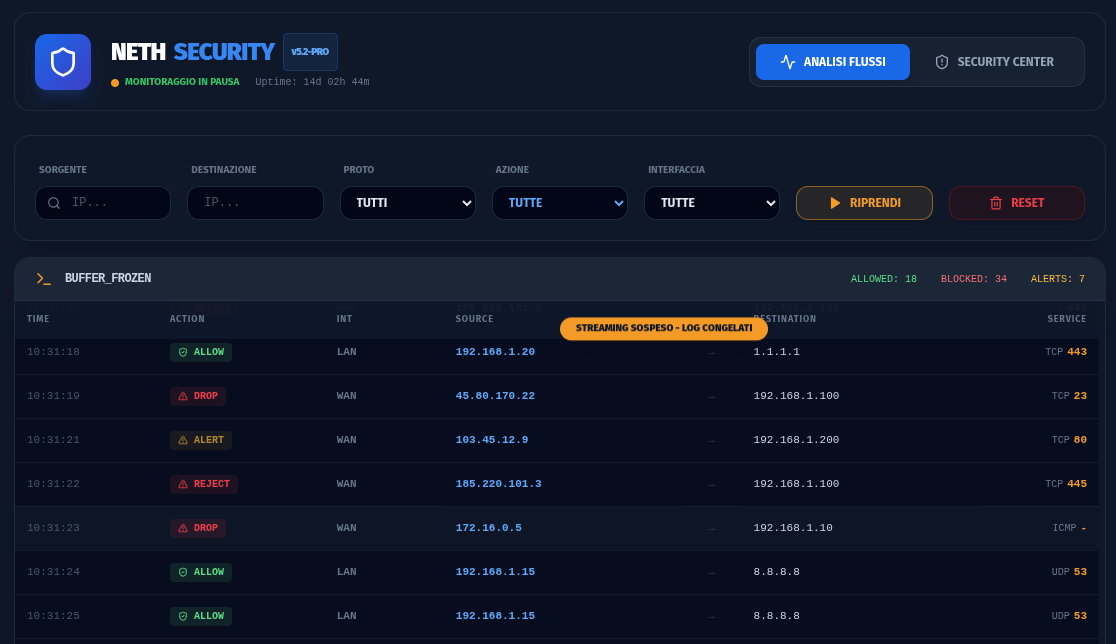
What I’m dreaming of is a native, decoded, real-time firewall live view, like the ones that pfSense, OPNsense, and even Sophos Home Edition 22.0 users enjoy. Ideally, it would show instantly:
Allow / Block decision
Source IP
Destination IP
Protocol and port
🖧 Interface
Firewall rule or policy that matched
Basically, I want to be able to see traffic and drops happening live, without needing to set up Grafana + Loki, Graylog, or some other external rocket science solution just to figure out who’s naughty and who’s nice.
Right now, syslog + external tools works, but let’s be honest — a firewall should give us immediate “I know what’s going on” superpowers out of the box.
So… is a native real-time firewall live view on the roadmap, or maybe something you’re evaluating for future NethSecurity releases? Pretty please with a firewall on top?
From my point of view is this a combination of connection tracking - conntrack - flows (you don’t want every packet in this overview) and logging of blocked packets on the zones (you don’t see them in connections). Both available in Nethsecurity already.
Because of the quantity of information, I do export them with softflowd to an external server for connections and with syslog-ng to an external server for dropped packets. The tools on the external server are specialized for searching in these “big data”, pointing out interesting information and anomalies, they are application aware, they summarize the data and give general overviews. A simple table would be (maybe) interesting on a very small network and not so useful with the lack of specialized tools for analyzing the data.
Not going to shy away from this one, we are aware we need something like this. This is indeed the target we prefixed with @davide_marini: more monitoring and easier. We started with updating netifyd to v5 (already rolled out) that gives a ton of insights on the connections, this will then allow us to release the flows view that I mentioned here.
We’ll be keeping on adding features on monitoring as we go, I have some aces up my sleeves on how to track this traffic without flooding the logs, it will need time, but we’ll get there. Controller too will need some adjustments, still something to look for as we go.
If you want something that tracks everything and it’s already here, you can go over our friends over at Netify, since you can enable NethSecurity to send all the traffic data there to be aggregated and stored. I am mentioning them just cause we use their engine to detect and catalog all the traffic, and their software is really well made.
Thanks a lot for the detailed and transparent answer, it’s really appreciated
I fully understand and agree that a proper live firewall view should not be about logging
every single packet, but rather about a smart combination of:
connection tracking / flows for allowed traffic
visibility of blocked packets per zone (which never become flows)
This is exactly what makes tools like pfSense, OPNsense and Sophos Home Edition effective
for real-time troubleshooting: not raw logs, but a clear, decoded, operational live view.
So, just to confirm and align expectations:
is a native real-time firewall live view (based on flows + blocked traffic),
something that is actually on the roadmap, or at least actively evaluated
for future NethSecurity releases?
It’s great to hear that netifyd v5 and the upcoming flows view are concrete steps in
this direction, and the idea of tracking traffic without flooding logs sounds very promising.
External tools (Netify Cloud, Grafana, etc.) work well and I use them too,
but having a lightweight, native, real-time view directly in the GUI
would be a huge usability win during day-to-day operations and incidents.
Thanks again for the openness — and yes, pretty please, with a firewall on top
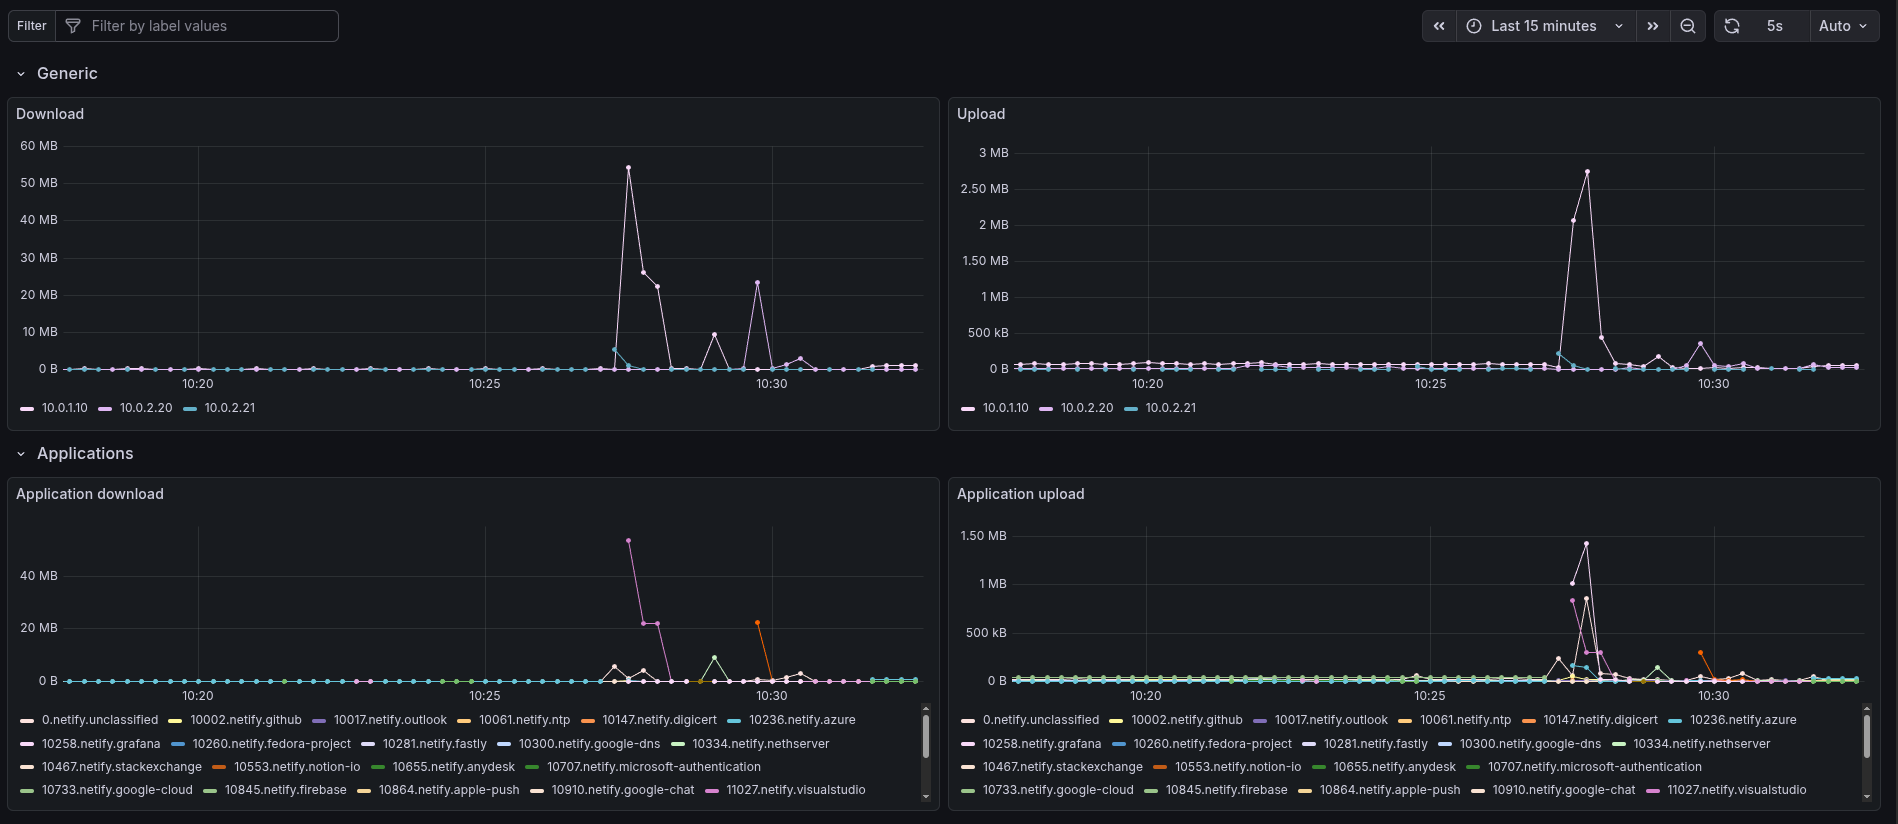
I love to spoil internal testing stuff, something local might come, I am currently using a combination of VictoriaMetrics and Telegraf to extract current traffic in the firewall (through netifyd) and put them in a long term storage.
Telegraf is a swiss army knife for data scraping and transformation, so not only netifyd traffic can be parsed, additional data might be added in the future, such as what you posted above.
Currently using grafana to query the data inside the firewall, but as an example we might (not confirmed, do not take my words for granted) get something on this lines:
his is actually very interesting — thanks for sharing this, even as an internal experiment
The VictoriaMetrics + Telegraf + netifyd approach makes a lot of sense, especially if the goal
is to extract meaningful traffic data, keep it structured, and avoid flooding raw logs.
Using Telegraf as a “Swiss Army knife” for scraping and transforming data sounds like a very
solid foundation for future expansion.
What you describe is very much aligned with what I (and probably many others) mean by
a “real-time firewall live view”: not a packet dump, but a clear, flow-oriented,
operational view of what is happening right now on the firewall.
The Grafana mockup you mentioned is especially promising. Even a simplified native version
of that concept — focused on:
current flows
blocked traffic visibility
fast filtering and drill-down
would already be a huge step forward compared to raw logs.
I completely understand this is exploratory and not confirmed, but it’s great to see that
this direction is being actively experimented with. It definitely feels like the right
path toward a usable, native live monitoring experience.
Looking forward to seeing how this evolves — and thanks again for the openness and
the technical insight.
 Allow /
  Block decision
 Source IP
 Protocol and port
 Firewall rule or policy that matched