EddieA
May 23, 2025, 6:18pm
1
I’m trying out the new Metrics/Grafana now built into the Core of NS8.
After turning on Alert Notifications, I’ve been flooded (well, just over 100 in the last 12 hours) with mails. The only problem is that they all have no Subject and the body is empty.
How do I trace what’s going on here.
Cheers.
mrmarkuz
May 23, 2025, 6:34pm
2
Are you using Debian or Rocky?
Do you use “Manual configuration” or the “mail instance” for the notifications?
Are there errors on the logs page? You could set the filter to the metrics app.
EddieA
May 23, 2025, 7:36pm
3
Rocky.
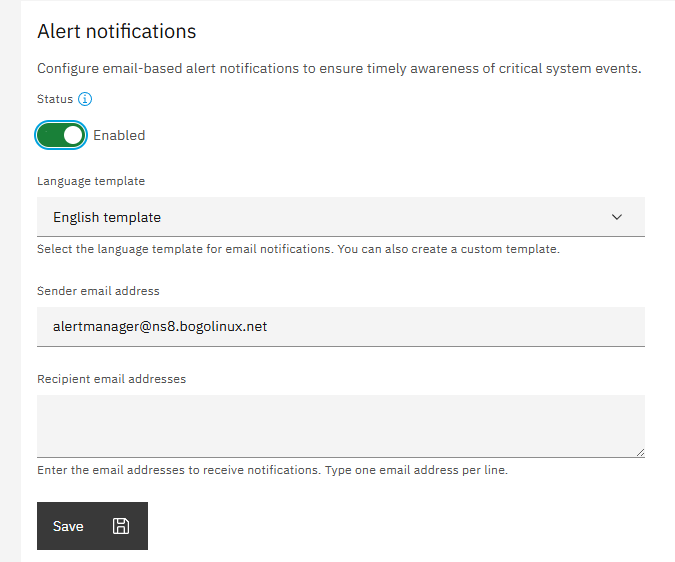
I didn’t see that option. I just enabled mails and it suggested the Template and sender mail address and let me fill in the recipient, as per:
I guess this has something to do with it:
2025-05-23T12:31:00-07:00 [1:metrics1:grafana] logger=authn.service t=2025-05-23T19:31:00.359466752Z level=info msg="Failed to authenticate request" client=auth.client.basic error="[password-auth.failed] too many consecutive incorrect login attempts for user - login for user temporarily blocked"
Cheers.
1 Like
mrmarkuz
May 23, 2025, 7:50pm
4
Thanks, you found a bug. I could reproduce it.
After enabling the notifications and triggering an event (I disabled swap) empty mails are sent.
I think following log entry shows the error:
2025-05-23T21:27:54+02:00 [1:metrics1:alertmanager] time=2025-05-23T19:27:54.246Z level=ERROR source=dispatch.go:360 msg="Notify for alerts failed" component=dispatcher num_alerts=1 err="mail-alert/email[0]: notify retry canceled due to unrecoverable error after 1 attempts: execute \"Subject\" header template: template: :1:12: executing \"\" at <{{template \"default_en_subject\" .}}>: template \"default_en_subject\" not defined"
EddieA
May 23, 2025, 8:39pm
5
Yeah, I see that message now I know what to look for, hidden in the thousands and thousands of the “Failed to authenticate request” messages.
Cheers.
1 Like
mrmarkuz
May 23, 2025, 9:42pm
6
I think the default alert mail templates are missing. In this case I tested the UI but unfortunately didn’t get that the notifications aren’t working. Sorry for that.
As a workaround you could create a custom alert mail template, see GitHub - NethServer/ns8-metrics: NS8 metrics and alerts but I recommend to wait for the fix.
giacomo
May 26, 2025, 2:44pm
8
Markus opened an issue: Alertmanager sends empty alert notification mails · Issue #7479 · NethServer/dev · GitHub
The fix is ready for testing.
We create a wrong UI: the language parameter is not still supported.
2 Likes
mrmarkuz
May 27, 2025, 6:26am
10
In this case the NS8 core was updated.
Fresh Installation:
curl https://raw.githubusercontent.com/NethServer/ns8-core/main/core/install.sh > install.sh
bash install.sh ghcr.io/nethserver/core:3.8.1-dev.1
Update:
api-cli run update-core --data '{"core_url":"ghcr.io/nethserver/core:3.8.1-dev.1","nodes":[1],"force":true}'
EddieA
May 28, 2025, 2:00am
11
Sorry, still getting blank mails:
2025-05-27T18:44:25-07:00 [1:metrics1:prometheus] time=2025-05-28T01:44:25.001Z level=ERROR source=notifier.go:624 msg="Error sending alerts" component=notifier alertmanager=http://localhost:9093/api/v2/alerts count=1 err="Post \"http://localhost:9093/api/v2/alerts\": context deadline exceeded"
2025-05-27T18:45:51-07:00 [1:metrics1:alert-proxy] Received alert: {"receiver": "default-receiver", "status": "firing", "alerts": [{"status": "firing", "labels": {"alertname": "node_offline", "instance": "10.5.4.1:9100", "job": "providers", "node": "1", "severity": "critical"}, "annotations": {"description": "A cluster target has disappeared. An exporter might be crashed.\n  VALUE = 0\n  LABELS = map[__name__:up instance:10.5.4.1:9100 job:providers node:1]", "summary": "Cluster node offline (instance 10.5.4.1:9100)"}, "startsAt": "2025-05-28T01:44:08.181Z", "endsAt": "0001-01-01T00:00:00Z", "generatorURL": "/graph?g0.expr=up%7Bjob%3D%22providers%22%7D+%3D%3D+0&g0.tab=1", "fingerprint": "1df3e074eb485d2c"}], "groupLabels": {"alertname": "node_offline", "node": "1"}, "commonLabels": {"alertname": "node_offline", "instance": "10.5.4.1:9100", "job": "providers", "node": "1", "severity": "critical"}, "commonAnnotations": {"description": "A cluster target has disappeared. An exporter might be crashed.\n  VALUE = 0\n  LABELS = map[__name__:up instance:10.5.4.1:9100 job:providers node:1]", "summary": "Cluster node offline (instance 10.5.4.1:9100)"}, "externalURL": "http://ns8.bogolinux.net:9093", "version": "4", "groupKey": "{}/{service=~\".*\"}:{alertname=\"node_offline\", node=\"1\"}", "truncatedAlerts": 0}
2025-05-27T18:45:52-07:00 [1:metrics1:alert-proxy] ALERT CRITICAL node:offline:1
2025-05-27T18:45:52-07:00 [1:metrics1:alert-proxy] No auth token, alert not sent
2025-05-27T18:46:49-07:00 [1:metrics1:alertmanager] time=2025-05-28T01:46:47.994Z level=ERROR source=dispatch.go:360 msg="Notify for alerts failed" component=dispatcher num_alerts=1 err="mail-alert/email[0]: notify retry canceled due to unrecoverable error after 1 attempts: execute \"Subject\" header template: template: :1:12: executing \"\" at <{{template \"default_en_subject\" .}}>: template \"default_en_subject\" not defined"
2025-05-27T18:50:50-07:00 [1:metrics1:alertmanager] time=2025-05-28T01:50:50.777Z level=ERROR source=dispatch.go:360 msg="Notify for alerts failed" component=dispatcher num_alerts=1 err="mail-alert/email[0]: notify retry canceled due to unrecoverable error after 1 attempts: execute \"Subject\" header template: template: :1:12: executing \"\" at <{{template \"default_en_subject\" .}}>: template \"default_en_subject\" not defined"
And no, my node isn’t offline.
*** Update ***
I was just pulling this screen shot, to show the updated module was loaded:
I’ll now install the official update and wait again.
Cheers.
mrmarkuz
May 28, 2025, 6:17am
12
Sorry, the template needs to be removed manually.
api-cli run module/metrics1/configure-module --data '{"prometheus_path": "prometheus", "grafana_path": "grafana", "mail_to": ["alert@nethserver.org"], "mail_from": "no-reply@nethserver.org", "mail_template": ""}'
To apply the changes restart the service:
runagent -m metrics1 systemctl --user restart alertmanager